. 2011 Sep;179(3):1243-56.
doi: 10.1016/j.ajpath.2011.05.037. Epub 2011 Jul 14.

Colony-stimulating factor-1 promotes kidney growth and repair via alteration of macrophage responses

Affiliations

Colony-stimulating factor-1 promotes kidney growth and repair via alteration of macrophage responses

Maliha A Alikhan et al. Am J Pathol. 2011 Sep.

Abstract

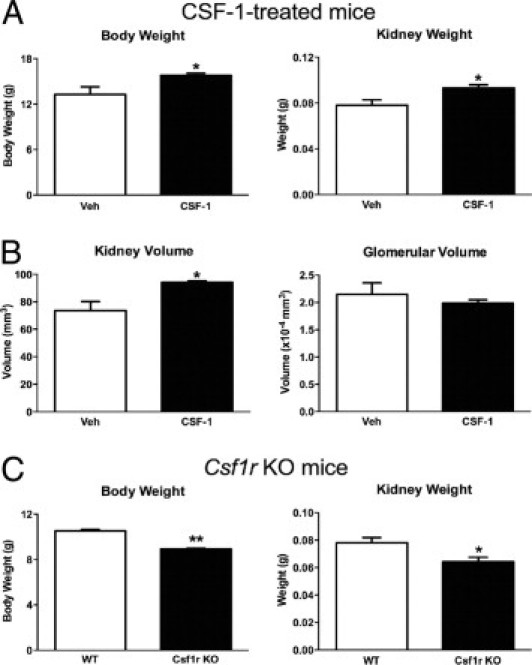
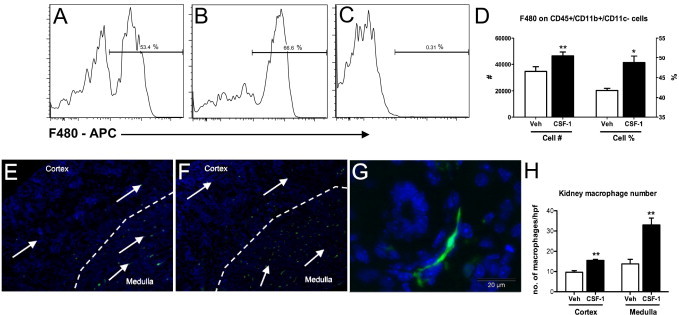
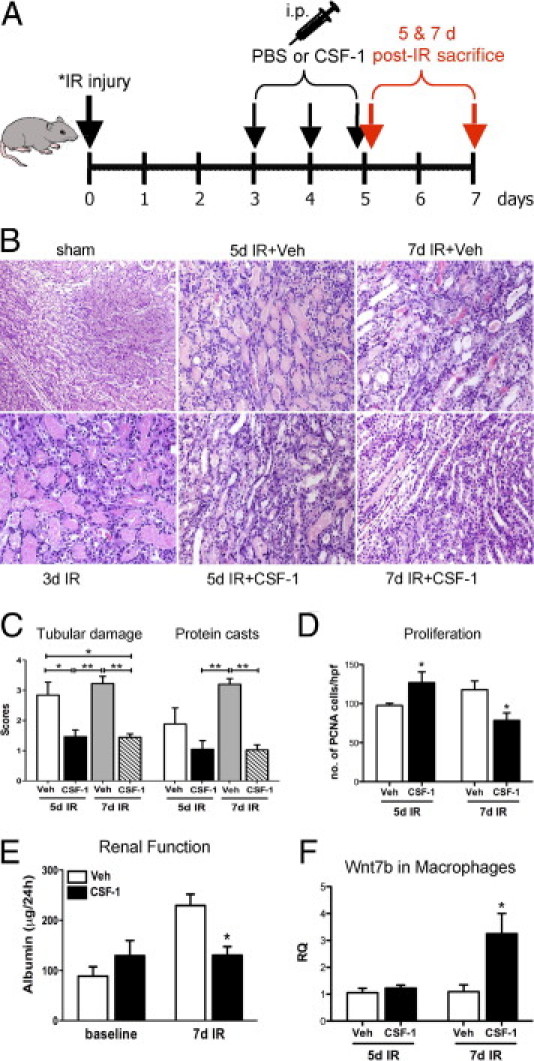
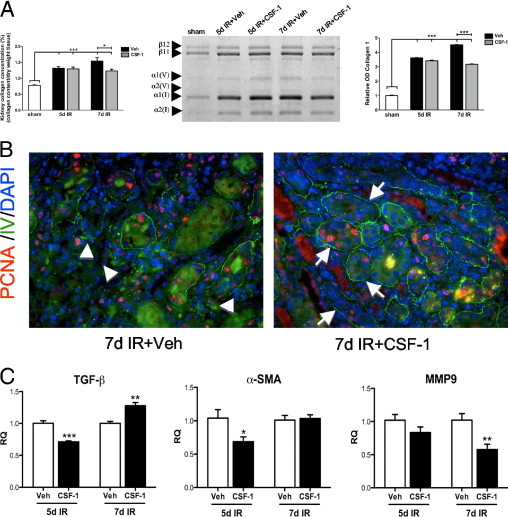
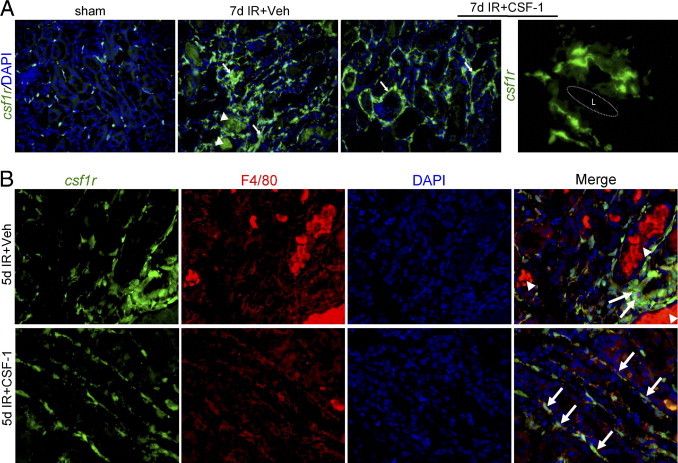
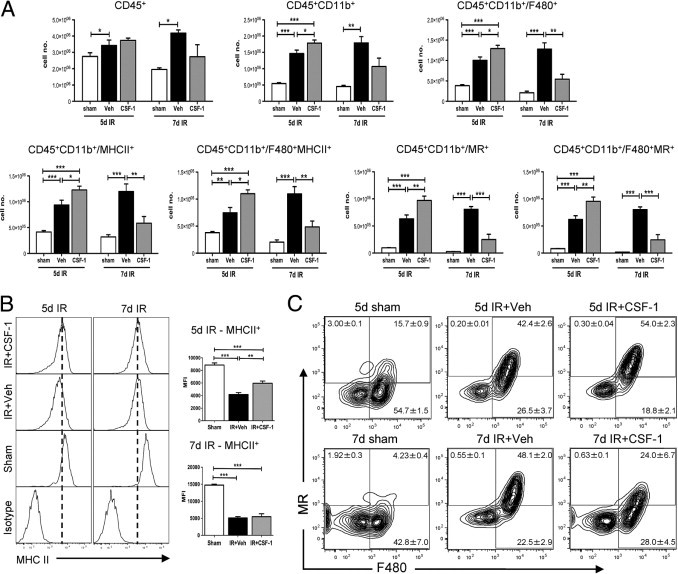
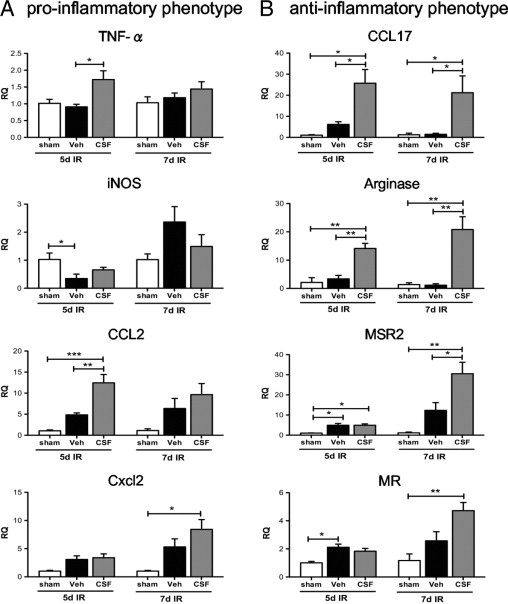
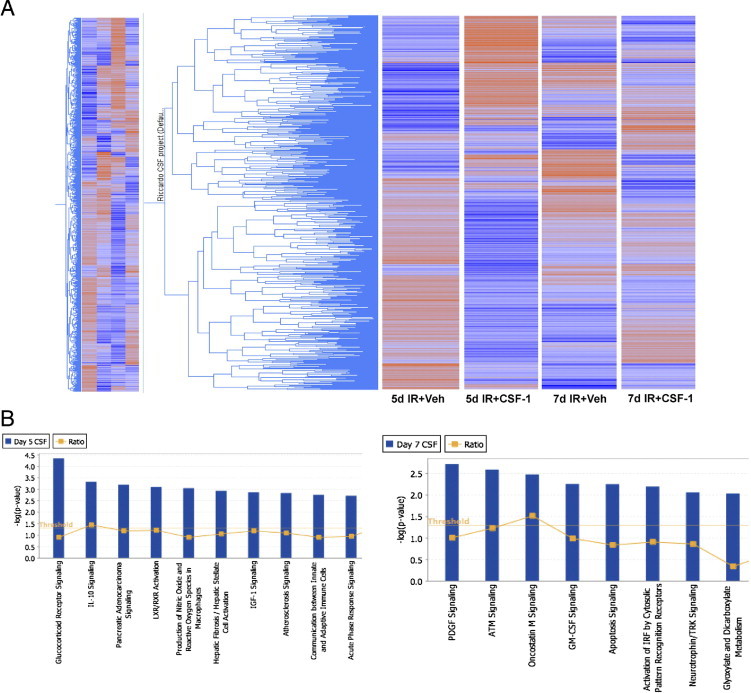
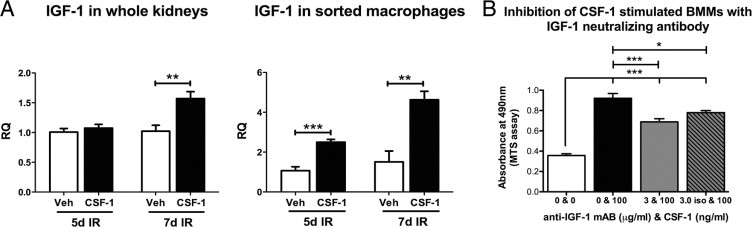
Colony-stimulating factor (CSF)-1 controls the survival, proliferation, and differentiation of macrophages, which are recognized as scavengers and agents of the innate and the acquired immune systems. Because of their plasticity, macrophages are endowed with many other essential roles during development and tissue homeostasis. We present evidence that CSF-1 plays an important trophic role in postnatal organ growth and kidney repair. Notably, the injection of CSF-1 postnatally enhanced kidney weight and volume and was associated with increased numbers of tissue macrophages. Moreover, CSF-1 promotes postnatal renal repair in mice after ischemia-reperfusion injury by recruiting and influencing macrophages toward a reparative state. CSF-1 treatment rapidly accelerated renal repair with tubular epithelial cell replacement, attenuation of interstitial fibrosis, and functional recovery. Analysis of macrophages from CSF-1-treated kidneys showed increased expression of insulin-like growth factor-1 and anti-inflammatory genes that are known CSF-1 targets. Taken together, these data suggest that CSF-1 is important in kidney growth and the promotion of endogenous repair and resolution of inflammatory injury.


Figures

Figure 1
Figure 1
CSF-1 administration to newborn mice increased body and kidney weights and kidney volume, and in comparison csf1r knockout mice exhibit decreased body and kidney weights. A: Mean body and kidney weights of CSF-1 or vehicle control mice at P30, after injection at P0.5, P1.5, and P2.5 (n = 8 per group). CSF-1-treated mice had a 19% increase in body weight (P = 0.02) and a 19% increase in kidney weight (P = 0.04) compared with vehicle-injected controls. B: Unbiased stereologic estimation of kidney and glomerular volumes at P30 after littermates received either CSF-1 or vehicle control (n = 3 per group). Kidney volume was increased by 28% (P = 0.04), whereas no significant change in glomerular volume was observed. C:Csf1r knockout mice had significantly decreased body and kidney weights compared with wild-type animals (n = 3 per group). Body weight was decreased by 15% (P = 0.0002) and kidney weight by 28% (P = 0.048). Data were analyzed with a Student's t-test (unpaired, 2-tailed); *P < 0.05, **P < 0.005. Data are mean ± SEMs. KO, knockout; Veh, vehicle; WT, wild type.
Figure 2
Figure 2
Macrophage infiltration is increased in kidneys at P5 after treatment with CSF-1. A–D: Flow cytometric analysis of whole kidneys indicates CD45+CD11b+CD11c/F480+ renal macrophages are increased in CSF-1-treated mice at P5. Representative histograms show an increase in CD45+CD11b+CD11c cells expressing the macrophage marker F4/80 with CSF-1 treatment (B) compared with littermate vehicle-injected controls (A). C: Positive staining was confirmed with appropriate isotype controls. EG: Representative images with the use of fluorescent microscopy show csf1r-EGFP macrophage infiltration (arrows) in kidneys at P5 after treatment with either CSF-1 or vehicle control at P1, P2, and P3 (n = 4 per group). Nuclei are stained with DAPI (blue). Low magnification (×100) shows that kidneys treated with CSF-1 (F) had increased numbers of macrophages in the renal medulla and cortex, compared with vehicle controls (E). G:Csf1r-EGFP macrophages show a spindle-shaped structure, wrapping around newly developed structures. H: Estimation of the number of renal csf1r-EGFP macrophages showed a 42% (P = 0.004) increase in macrophages within the cortex and a 157% (P = 0.003) increase within the medulla after treatment with CSF-1, compared with vehicles (n = 3 to 4 per group). Data were analyzed with a Student's t-test (unpaired, 2-tailed); *P < 0.05, **P < 0.01. Data are means ± SEMs. Veh, vehicle.
Figure 3
Figure 3
CSF-1 treatment, starting at 3 days after IR injury, accelerates endogenous cellular repair and improves renal function in adult mice after IR injury. A: Schematic diagram of the dosing regimen for CSF-1 therapy, beginning at 3 days after unilateral (40 minutes) or bilateral (25 minutes) renal artery clamping. B: Representative H&E-stained sections showing the histoarchitecture of the OSOM from sham control (original magnification, ×200), 3 days after unilateral IR kidney, 5 and 7 days after unilateral IR kidneys with vehicle or CSF-1 injections (original magnification, ×400). C: Semiquantitative analysis of kidney injury from kidneys 5 and 7 days after IR with vehicle or CSF-1 treatment. Data were analyzed by a one-way analysis of variance with an accompanying Tukey's post hoc test for multiple comparisons; *P < 0.05, **P < 0.01, and ***P < 0.001. D: Tubular epithelial cell proliferation measured by immunostaining with PCNA in kidneys 5 and 7 days after IR treated with CSF-1 or vehicle injections. Data were analyzed with a Student's t-test (unpaired, 2-tailed); *P < 0.05. E: Functional analysis measuring 24-hour urinary albumin excretion at baseline and in kidneys 7 days after bilateral IR. Albumin data were analyzed with a two-way analysis of variance; *P < 0.05. F: qPCR analysis of Wnt7b expression in sorted macrophage populations at 5 and 7 days after IR in kidneys treated with CSF-1 or vehicle injections. Data were analyzed with a Student's t-test (unpaired, 2-tailed); *P = 0.03. Data are means ± SEMs (n = 5 to 6 per group). RQ, relative quantification; Veh, vehicle.
Figure 4
Figure 4
CSF-1 reduces renal fibrosis by 7 days after IR injury. A: Kidney collagen concentration, SDS-PAGE analysis, and densitometry of sham, and kidneys 5 and 7 days after IR treated with CSF-1 or vehicle. Type I collagen monomers are represented by α1(I) and α2(I) chains, β11 represents dimers of two α1(I) chains, whereas β12 represents dimers of α1(I) and α2(I) chains. Type V collagen is represented by α1(V) and α2(V) chains. B: Representative fluorescent micrographs showing type IV collagen (green) and PCNA (red) staining at 7 days after IR injury with and without CSF-1 treatment. Original magnification, ×400. Type IV collagen in the CSF-1-treated IR kidneys displays a fine supportive network around re-epithelialized tubules (arrows) compared with interstitial collagen accumulation (arrowheads) and disruption of the tissue architecture evidence in vehicle-injected controls. C: qPCR analysis of TGF-β, α-SMA, and MMP9 expression in sorted macrophage populations of kidneys at 5 and 7 days after IR treated with CSF-1 or vehicle injections. Hydroxyproline and densitometry data were analyzed with a one-way analysis of variance with an accompanying Tukey's post hoc test. qPCR analysis was analyzed with a Student's t-test (unpaired, 2-tailed); *P < 0.05, **P < 0.005, and ***P < 0.0001. Data are means ± SEMs (n = 5 to 6 per group). RQ, relative quantification; Veh, vehicle.
Figure 5
Figure 5
CSF-1 alters macrophage phenotype after IR injury. A: Representative fluorescent micrographs depicting the phenotypic changes of csf1r-EGFP (green) interstitial macrophages from sham control (original magnification, ×200) and kidneys 7 days after IR with and without CSF-1 treatment (original magnification, ×400). In vehicle-injected IR kidneys there is a marked infiltrate of interstitial macrophages (arrows) with autofluorescent tubular casts also evident (arrowheads). In comparison, kidneys from the CSF-1-treated mice had a prominent interstitial macrophage infiltrate that displayed a spindle-shaped structure (arrows). At high power the csf1r-EGFP macrophages in CSF-1-treated IR kidneys envelop the tubules with connecting cytoplasmic projections closely adjacent to the tubular basement membrane. Original magnification, ×1000. B: Representative immunofluorescence microscopy showing co-expression of F4/80 (red) with csf1r-EGFP macrophages (green) 5 days after IR injury with vehicle or CSF-1 injection. Original magnification, ×400. L, tubular lumen.
Figure 6
Figure 6
CD45+CD11b+CD11c renal macrophages in CSF-1-treated mice display an altered phenotype and cell number compared with vehicle-treated mice at 5 and 7 days after IR injury. Flow cytometric analysis was performed on sham-operated kidneys and kidneys 5 and 7 days after IR treated with vehicle or CSF-1. A: Flow cytometric quantification of leukocytes stained for F480, MR, and MHC class II on CD45+CD11b+CD11c renal macrophages. B: Representative histograms displaying the shift in mean fluorescent intensity of MHC class II+ cells gated on CD45+CD11b+CD11c/F480+ macrophages. C: Representative contour plots of F480 and MR co-expression on CD45+CD11b+CD11c macrophages. Positive staining was confirmed with appropriate isotype controls. Percentages of cells in each quadrant represent mean ± SEM. Statistical analysis was performed with a one-way analysis of variance with an accompanying Tukey's post hoc test for multiple comparisons; *P < 0.05, **P < 0.01, and ***P < 0.001. Data are means ± SEMs (n = 5 per group). MFI, mean fluorescent intensity; Veh, vehicle.
Figure 7
Figure 7
qPCR analysis of pro-inflammatory and anti-inflammatory gene expression in sorted CD45+CD11b+CD11c macrophages from sham-operated kidneys and kidneys 5 and 7 days after IR treated with CSF-1 or vehicle injections. Pro-inflammatory (INOS, TNF-α, CCL2, and Cxcl2) (A) and anti-inflammatory (CCL17, arginase, MSR2, and MR) (B) gene expression in response to CSF-1 treatment. Sham-operated kidneys were used as the baseline control. Statistical analysis was performed with a one-way analysis of variance with an accompanying Tukey's post hoc test for multiple comparisons; *P < 0.05, **P < 0.01, and ***P < 0.001. Data are means ± SEMs (n = 5 per group). RQ, relative quantification; Veh, vehicle.
Figure 8
Figure 8
Microarray analysis of sorted macrophage populations from kidneys 5 and 7 days after IR with or without CSF-1 therapy. A: Hierarchical cluster of expressed genes in each group, where blue represents low gene expression and red represents high gene expression. B: Canonical signaling pathways significantly overrepresented in sorted macrophages from kidneys 5 and 7 days after IR with CSF-1 therapy compared with vehicle treatment. The threshold line indicates the cutoff probability (P < 0.05) calculated from a right-tailed Fisher's exact test within the Ingenuity Pathway Analysis software version 8.8 (Ingenuity Systems). The ratio line indicates the number of genes from the gene list that pass cutoff criteria in the pathway divided by the total number of genes in the pathway. ATM, ataxia telangiectasia mutated; LXR/RXR, liver X receptor/retinoid X receptor; TRK, tyrosine kinase receptor; Veh, vehicle.
Figure 9
Figure 9
CSF-1 can promote macrophage growth and cell proliferation by IGF-1 signaling. A: qPCR analysis of IGF-1 expression in adult kidneys and sorted macrophages 5 and 7 days after IR injury with and without CSF-1 treatment. B: MTS proliferation assay of BMMs cultured with CSF-1 (100 ng/mL) in the presence of IGF-1 neutralizing antibody (3 μg/mL). qPCR data were analyzed with a Student's t-test (unpaired, 2-tailed), and MTS proliferation data were analyzed with a one-way analysis of variance with an accompanying Tukey's post hoc test for multiple comparisons; *P < 0.01, **P < 0.01, and ***P < 0.001. Data are means ± SEMs (n = 5 per group). RQ, relative quantification; Veh, vehicle.

References

    1. Ovchinnikov D.A. Macrophages in the embryo and beyond: much more than just giant phagocytes. Genesis. 2008;46:447–462. - PubMed
    1. Pollard J.W. Trophic macrophages in development and disease. Nat Rev Immunol. 2009;9:259–270. - PMC - PubMed
    1. Rae F., Woods K., Sasmono T., Campanale N., Taylor D., Ovchinnikov D.A., Grimmond S.M., Hume D.A., Ricardo S.D., Little M.H. Characterisation and trophic functions of murine embryonic macrophages based upon the use of a Csf1r-EGFP transgene reporter. Dev Biol. 2007;308:232–246. - PubMed
    1. Hume D.A., Ross I.L., Himes S.R., Sasmono R.T., Wells C.A., Ravasi T. The mononuclear phagocyte system revisited. J Leukoc Biol. 2002;72:621–627. - PubMed
    1. Lichanska A.M., Hume D.A. Origins and functions of phagocytes in the embryo. Exp Hematol. 2000;28:601–611. - PubMed

Publication types

MeSH terms

Substances