. 2011 Oct;107(1):156-68.
doi: 10.1016/j.pbiomolbio.2011.06.011. Epub 2011 Jul 7.

3D virtual human atria: A computational platform for studying clinical atrial fibrillation

Affiliations

3D virtual human atria: A computational platform for studying clinical atrial fibrillation

Oleg V Aslanidi et al. Prog Biophys Mol Biol. 2011 Oct.

Abstract

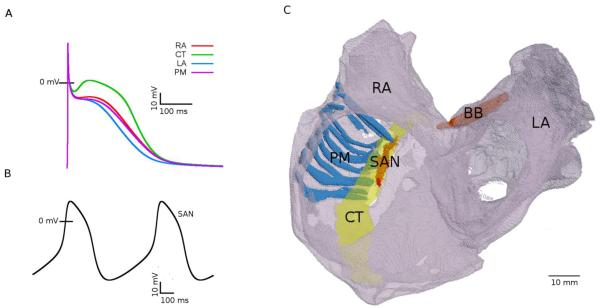
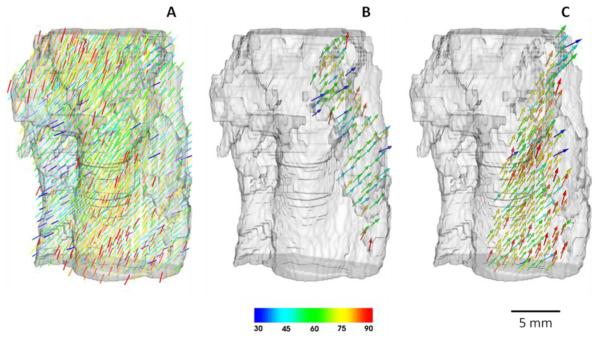
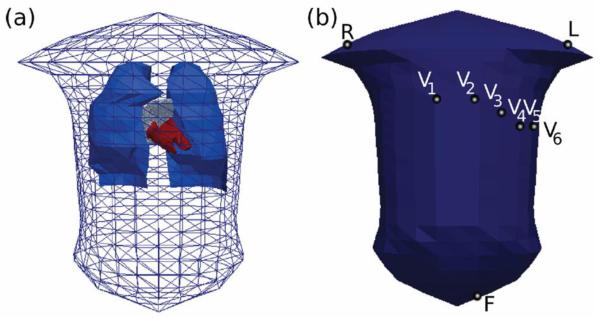
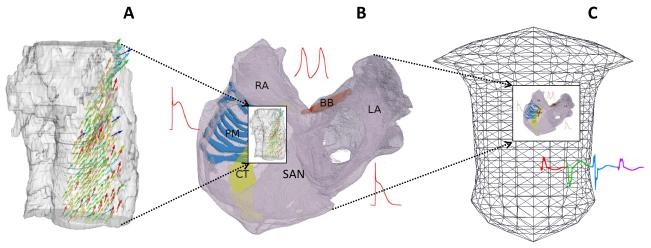
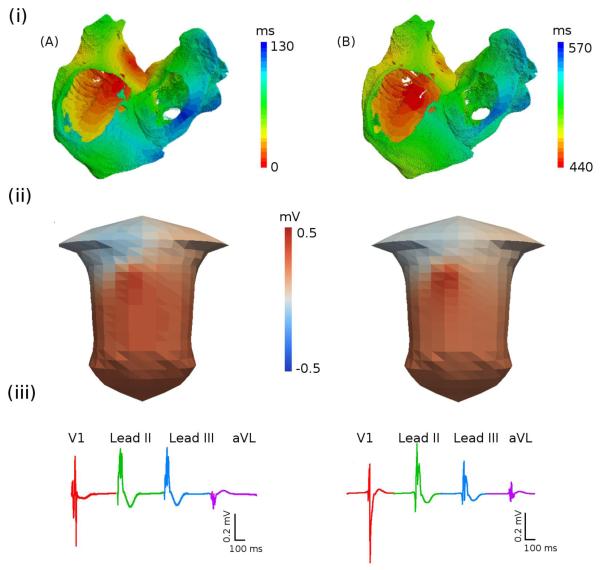
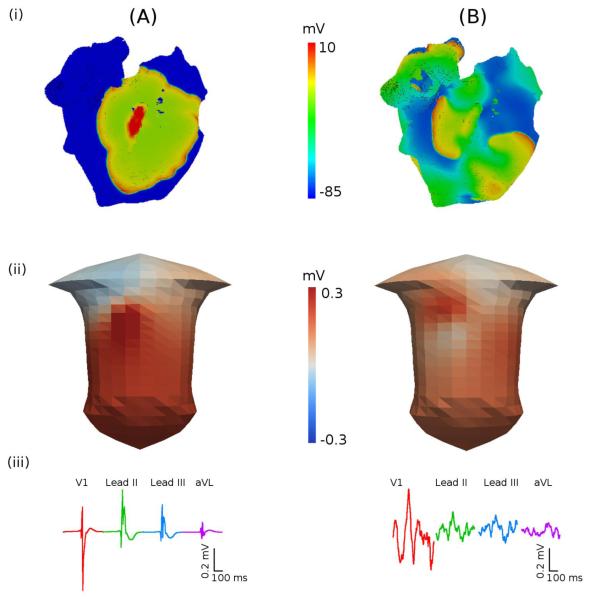
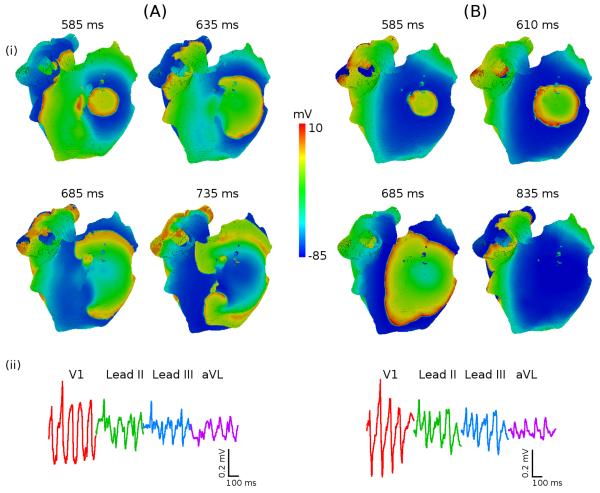
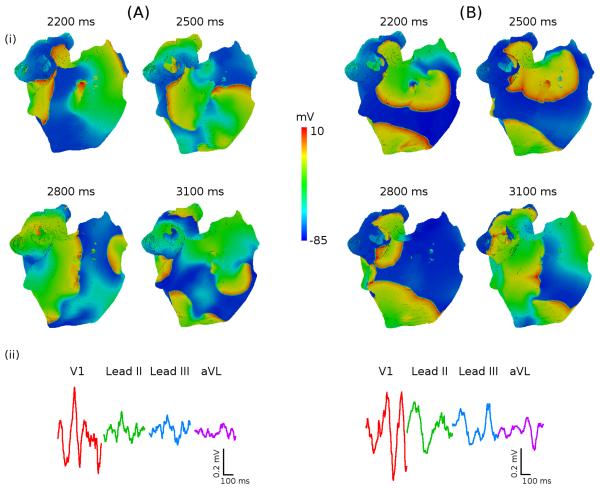
Despite a vast amount of experimental and clinical data on the underlying ionic, cellular and tissue substrates, the mechanisms of common atrial arrhythmias (such as atrial fibrillation, AF) arising from the functional interactions at the whole atria level remain unclear. Computational modelling provides a quantitative framework for integrating such multi-scale data and understanding the arrhythmogenic behaviour that emerges from the collective spatio-temporal dynamics in all parts of the heart. In this study, we have developed a multi-scale hierarchy of biophysically detailed computational models for the human atria--the 3D virtual human atria. Primarily, diffusion tensor MRI reconstruction of the tissue geometry and fibre orientation in the human sinoatrial node (SAN) and surrounding atrial muscle was integrated into the 3D model of the whole atria dissected from the Visible Human dataset. The anatomical models were combined with the heterogeneous atrial action potential (AP) models, and used to simulate the AP conduction in the human atria under various conditions: SAN pacemaking and atrial activation in the normal rhythm, break-down of regular AP wave-fronts during rapid atrial pacing, and the genesis of multiple re-entrant wavelets characteristic of AF. Contributions of different properties of the tissue to mechanisms of the normal rhythm and arrhythmogenesis were investigated. Primarily, the simulations showed that tissue heterogeneity caused the break-down of the normal AP wave-fronts at rapid pacing rates, which initiated a pair of re-entrant spiral waves; and tissue anisotropy resulted in a further break-down of the spiral waves into multiple meandering wavelets characteristic of AF. The 3D virtual atria model itself was incorporated into the torso model to simulate the body surface ECG patterns in the normal and arrhythmic conditions. Therefore, a state-of-the-art computational platform has been developed, which can be used for studying multi-scale electrical phenomena during atrial conduction and AF arrhythmogenesis. Results of such simulations can be directly compared with electrophysiological and endocardial mapping data, as well as clinical ECG recordings. The virtual human atria can provide in-depth insights into 3D excitation propagation processes within atrial walls of a whole heart in vivo, which is beyond the current technical capabilities of experimental or clinical set-ups.


Figures

Figure 1
Figure 1
Electrophysiologically and anatomically heterogeneous model of the human atria. A: AP profiles in the RA, LA, PM and CT cells at the cycle length of 700 ms. B: spontaneous APs in the SAN; C: 3D anatomical model of the human atria showing the main conductive bundles. Bulk atrial tissue in the LA and RA is anatomically homogeneous (translucent grey). The SAN and the major conductive bundles (CT, PM and BB) are coloured and marked by the respective abbreviations.
Figure 2
Figure 2
Anatomical model of the human SAN with fibre orientations. Fibre directions are indicated by the direction as well as the colour of the arrows; the palette shows values of the fibre angle in respect to the horizontal plane (such that 900 corresponds to vertical fibres) A: The entire tissue comprising the SAN and surrounding atrium. B: SAN formed by loosely packed nodal cells. C: Atial tissue in the area of CT - atrial cells are largely aligned along the CT and towards the SAN.
Figure 3
Figure 3
Model of the human torso. A: The torso geometry used in the body surface potential simulations, shown here with the lungs (blue) and heart blood masses (red) within the surface mesh. B: Triangular elements selected as the positions of the electrodes used for deriving 12-lead ECGs. Lead potentials are defined as super-positions of the body surface potentials under the electrodes shown in (B): lead II = F - R, lead III = F - L, lead aVL = L - (R + F)/2, lead aVF = F - (R + L)/2.
Figure 4
Figure 4
Multi-scale interactions of the multi-scale models of the human atria. A: DT-MRI reconstruction of the geometry and fibre orientation the human SAN and surrounding RA can be integrated into B: 3D model of the whole atria, which can be incorporated into C: the torso model.
Figure 5
Figure 5
Activation sequence of the atria during the sinus rhythm. A: Paced atrial model without the SAN. B: Atrial model with the pacemaking SAN. (i) Atrial activation times (measured as the time for a cell to reach the membrane potential of −60 mV); (ii) snapshots of the BSP distributions on the surface of the torso; (iii) P-waves in four representative ECG leads.
Figure 6
Figure 6
AP propagation in the 3D model of the human atria. A: Spontaneous normal rhythm. B: Pacing-induced AF. (i) snapshots of the membrane potential distribution on the epicardial surface of the atria; (ii) snapshots of the BSP in the torso; (iii) P-waves in four representative ECG leads.
Figure 7
Figure 7
Role of atrial heterogeneity in the initiation of re-entry. A: Re-entry in heterogeneous atria. B: Focal activity in homogeneous atria. In both A and B, the RA is paced at the cycle length of 200 ms between the CT and PMs. (i) snapshots of the potential distribution on the epicardial surface of the atria for successive moments of time; (ii) P-waves in four representative ECG leads.
Figure 8
Figure 8
Role of atrial anisotropy in the genesis of AF. A: Multiple meandering wavelents in anisotropic atria. B: Pair of re-entrant waves in isotropic atria. In both A and B, re-entry is initiated as shown in Figure 7A. RA (i) snapshots of the potential distribution on the epicardial surface of the atria for successive moments of time; (ii) P-waves in four representative ECG leads. ECG in the anisotropic case A(ii) shows “flutter wave” in lead V1 and “saw-tooth” morphologies in other leads, which are features of clinical AF. ECG in the isotropic case B(ii) shows P-waves with clear peaks.

References

    1. Allessie MA, Bonke FI, Schopmann FTG. Circus movement in rabbit atrial muscle as a mechanism of tachycardia. II. The role of nonuniform recovery of excitability in the occurrence of unidirectional block studied with multiple microelectrodes. Circ Res. 1976;39:168–77. - PubMed
    1. Anter E, Jessup M, Callans DJ. Atrial fibrillation and heart failure: treatment considerations for a dual epidemic. Circulation. 2009;119:2516–25. - PubMed
    1. Aslanidi OV, Boyett MR, Dobrzynski H, Li J, Zhang H. Mechanisms of transition from normal to re-entrant electrical activity in a model of rabbit atrial tissue: interaction of tissue heterogeneity and anisotropy. Biophys J. 2009;96:798–817. - PMC - PubMed
    1. Arora R, Verheule S, Scott L, et al. Arrhythmogenic substrate of the pulmonary veins assessed by high-resolution optical mapping. Circulation. 2003;107:1816–21. - PMC - PubMed
    1. Basser PJ, Mattiello J, LeBihan D. Estimation of the effective self-diffusion tensor from the NMR spin echo. J Magnet Res Med. 1994;30:201–206. - PubMed

Publication types