Heterogeneity of functional activation during memory encoding across hippocampal subfields in temporal lobe epilepsy
- PMID: 21763431
- PMCID: PMC3285462
- DOI: 10.1016/j.neuroimage.2011.06.085
Heterogeneity of functional activation during memory encoding across hippocampal subfields in temporal lobe epilepsy
Abstract
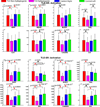
Pathology studies have shown that the anatomical subregions of the hippocampal formation are differentially affected in various neurological disorders, including temporal lobe epilepsy (TLE). Analysis of structure and function within these subregions using magnetic resonance imaging (MRI) has the potential to generate insights on disease associations as well as normative brain function. In this study, an atlas-based normalization method (Yushkevich, P.A., Avants, B.B., Pluta, J., Das, S., Minkoff, D., Mechanic-Hamilton, D., Glynn, S., Pickup, S., Liu, W., Gee, J.C., Grossman, M., Detre, J.A., 2009. A high-resolution computational atlas of the human hippocampus from postmortem magnetic resonance imaging at 9.4 T. NeuroImage 44 (2), 385-398) was used to label hippocampal subregions, making it possible to examine subfield-level functional activation during an episodic memory task in two different cohorts of healthy controls and subjects diagnosed with intractable unilateral TLE. We report, for the first time, functional activation patterns within hippocampal subfields in TLE. We detected group differences in subfield activation between patients and controls as well as inter-hemispheric activation asymmetry within subfields in patients, with dentate gyrus (DG) and the anterior hippocampus region showing the greatest effects. DG was also found to be more active than CA1 in controls, but not in patients' epileptogenic side. These preliminary results will encourage further research on the utility of subfield-based biomarkers in TLE.
Copyright © 2011 Elsevier Inc. All rights reserved.
Figures


References
-
- Andrade-Valença LPA, Valença MM, Velasco TR, Carlotti CG, Assirati JaA, Galvis-Alonso OY, Neder L, Cendes F, Leite JaP. Mesial temporal lobe epilepsy: clinical and neuropathologic findings of familial and sporadic forms. Epilepsia. 2008 Jun;49(6):1046–1054. - PubMed
-
- Bellgowan PS, Binder JR, Swanson SJ, Hammeke TA, Springer JA, Frost JA, Mueller WM, Morris GL. Side of seizure focus predicts left medial temporal lobe activation during verbal encoding. Neurology. 1998 Aug;51(2):479–484. - PubMed
-
- Bernasconi N, Bernasconi A, Caramanos Z, Antel SB, Andermann F, Arnold DL. Mesial temporal damage in temporal lobe epilepsy: a volumetric MRI study of the hippocampus, amygdala and parahippocampal region. Brain. 2003;126(2):462. - PubMed
Publication types
MeSH terms
Grants and funding
LinkOut - more resources
Full Text Sources
Medical
Miscellaneous

