. 2011 Nov;154(4):305-17.
doi: 10.1016/j.cbpc.2011.06.017. Epub 2011 Jul 6.

Novel cDNA sequences of aryl hydrocarbon receptors and gene expression in turtles (Chrysemys picta and Pseudemys scripta) exposed to different environments

Affiliations

Novel cDNA sequences of aryl hydrocarbon receptors and gene expression in turtles (Chrysemys picta and Pseudemys scripta) exposed to different environments

Emily C Marquez et al. Comp Biochem Physiol C Toxicol Pharmacol. 2011 Nov.

Abstract

Reproductive changes have been observed in painted turtles from a site with known contamination located on Cape Cod, MA, USA. We hypothesize that these changes are caused by exposure to endocrine-disrupting compounds and that genes involved in reproduction are affected. The aryl hydrocarbon receptor (AHR) is an orphan receptor that is activated by environmental contaminants. AHR mRNA was measured in turtles exposed to soil collected from a contaminated site. Adult turtles were trapped from the study site (Moody Pond, MP) or a reference site and exposed to laboratory environments containing soil from either site. The red-eared slider was used to assess neonatal exposure to soil and water from the sites. The environmental exposures occurred over a 13-month period. Juveniles showed an age-dependent increase in brain AHR1. Juvenile turtles exposed to the MP environment had elevated gonadal AHR1. Adult turtles exposed to the MP environment showed significantly decreased brain AHR2. The painted turtle AHR is the first complete reptile AHR cDNA sequence. Phylogenetic analysis of the painted turtle AHR showed that it clusters with other AHR2s. Partial AHR1 and partial AHR2 cDNA sequences were cloned from the red-eared slider. MEME analysis identified 18 motifs in the turtle AHRs, showing high conservation between motifs that overlapped functional regions in both AHR isoforms.


Figures

Figure 1
Figure 1
Diagram of experimental design. (a) Adult painted turtles trapped from Moody Pond or the reference site Washburn Pond were exposed to mimicked environments representing either their native environment or the foreign environment in the laboratory. The purpose of the “crossover” was to determine if gene expression profiles were similar in animals exposed to the same environment in the laboratory regardless of their origin site. Environmental exposure tanks contained soil from the study or reference site. Water from the sites could not be collected due to the logistical problem of storing large volumes of water for twice-weekly tank cleaning. (b) Neonate red-eared slider turtles were used to assess exposure of young animals to the study site or reference environments containing soil and water from the respective sites.
Figure 2
Figure 2
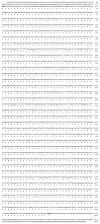
The painted turtle AHR2 cDNA sequence (GQ141218). Start and stop codons are indicated in boldface. The nucleotides and amino acids are numbered on the right.
Figure 3
Figure 3
Semiquantitative PCR tissue distribution of painted turtle AHR2. PCR primers were used to amplify a portion of AHR2 (position 1,458 to 2,279) in cDNA libraries from several painted turtle tissues. Samples from one male and one female from the reference site (Washburn Pond) are shown. The arrow indicates a second, smaller transcript that was amplified in muscle.
Figure 4
Figure 4
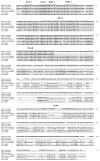
Alignment of turtle AHR amino acid sequences. The amino acid sequences of the AHRs were aligned using ClustalW 2.0 (Chenna et al., 2003). Numbers for painted turtle AHR are shown on the right. Domains were estimated based on alignments of avian AHRs (Yasui et al., 2007). Functional domains are labeled and the ligand-binding domain marked with an asterisk at each end. The complete painted turtle AHR2 is shown with the partial sequences for red-eared slider AHR1 and AHR2. Amino acids identical to the painted turtle AHR2 are boldfaced. Accession numbers are as follows: painted turtle AHR2 (GQ141218); red-eared slider AHR1 (HM640941.1) and AHR2 (HM640942); cormorant AHR1 (BAD01477) and AHR2 (BAF64245.1).
Figure 5
Figure 5
Phylogenetic analysis of AHR amino acid sequences. Sequences were gathered from NCBI (http://www.ncbi.nlm.nih.gov/) and aligned using ClustalW under default settings (Larkin et al., 2007). The alignment was trimmed to remove all gaps. It was then submitted to RAxML BlackBox, where maximum likelihood analysis was run for 100 bootstraps (Stamatakis et al., 2008). Accession numbers are as follows: zebrafish (Danio rerio) AHR1β (NP_001019987) and AHR2 (CAK11168); killifish (Fundulus heroclitus) AHR2 (AAC59696); chicken (Gallus gallus) AHR1 (AAF70373); human (Homo sapiens) AHR1 (AAH69390); gray-tailed opossum (Monodelphis domestica) AHR2 (XP_001365696); rainbow trout (Oncorhynchus mykiss) AHR2α (AAC95335); platypus (Ornithorhyncus anatinus) AHR2 (XP_001513826.1); cormorant (Phalacrocorax carbo) AHR1 and AHR2 (BAD01477, BAF64245.1); black-footed albatross (Phoebastria nigripes) AHR1 and AHR2 (BAC87795, BAC87796); Atlantic salmon (Salmo salar) AHR2γ (AAL12247); pufferfish (Takifugu rubripes) AHR2α (AAY96631); African clawed frog (Xenopus laevis) AHR1 (AAV49748). The dotted line surrounds all of the AHR2s analyzed. The scale bar indicates 0.01 expected amino acid substitutions per site.
Figure 6
Figure 6
Motif architecture of AHR amino acid sequences using Multiple Em for Motif Elicitation (MEME) analysis. Motifs (boxes) and inter-motif regions (horizontal lines) are drawn to scale. Conservation between motifs is indicated by vertical lines connecting the various motifs in common. Horizontal lines indicate the correspondence between the motifs and the basic helix-loop-helix (bHLH) and Per-ARNT-Sim (PAS) functional domains. Certain motifs were found to be specific to taxa, for example, motif 10 was only identified in avian AHRs. As a full-length reptile AHR1 has not yet been sequenced, a bird AHR1 (from the cormorant) is shown for comparison with the partial red-eared slider AHR1. Eighteen motifs were identified among all the AHRs compared and are listed in Table 3. The white motifs are unique to AHR1s and the black motifs are unique to AHR2s. Motifs 6 and 7 do not occur in the AHR1s shown in Figure 7, but were found in the other AHR1s analyzed. The sequences used in phylogenetic analysis in addition to 3 basal AHRs from invertebrates were used in the MEME analysis. Sequence accession numbers are listed in Materials and Methods.
Figure 7
Figure 7
Graph of mean normalized expression obtained from qPCR measurements of painted turtle brain AHR2 mRNA according to environmental exposure. “Environment” represents the environmental exposure, either to Moody (M) Pond sediment or Washburn (W) Pond sediment. “Origin” represents the pond where turtles were originally trapped, thus W/M indicates a Washburn origin turtle exposed to the Moody environment. The upper panel shows all individuals from the experiment, the lower panel shows individuals separated by sex. Data are represented as mean ± standard error of the mean. “A” indicates a statistically significant difference from “B” (ANOVA, P < 0.05).
Figure 8
Figure 8
Graph of mean normalized expression obtained from qPCR measurements of red-eared slider brain AHR1 mRNA according to environmental exposure. “Environment” represents the environmental exposure, i.e., exposure to either Moody Pond sediment and water, or Washburn Pond sediment and water. The upper panel shows all individuals from the experiment, the lower panel shows individuals separated by sex. Neonates were turtles sacrificed prior to starting the experiment. Data are represented as mean ± standard error of the mean. “A” indicates statistically significant difference from “B” (ANOVA, P < 0.05).
Figure 9
Figure 9
Graph of mean normalized expression obtained from qPCR measurements of red-eared slider gonadal AHR1 mRNA according to environmental exposure. “Environment” represents the environmental exposure, i.e., exposure to either Moody Pond sediment and water, or Washburn Pond sediment and water. The upper panel shows all individuals from the experiment, the lower panel shows individuals separated by sex. Data are represented as mean ± standard error of the mean. “A” indicates statistically significant difference from “B” (ANOVA, P < 0.05).

References

    1. Abnet CC, Tanguay RL, Hahn ME, Heideman W, Peterson RE. Two forms of aryl hydrocarbon receptor type 2 in rainbow trout (Oncorhynchus mykiss). Evidence for differential expression and enhancer specificity. J Biol Chem. 1999;274:15159–15166. - PMC - PubMed
    1. AFCEE. Massachusetts Military Reservation Plume Response Program, Prepared for AFCEE/MMR, Installation Restoration Program by Portage Ennvironmental Inc. Otis ANGB; MA, USA: 2003. US Air Force Center for Environmental Excellence (USAFCEE) Draft Final Second Five-year Review, 1998–2002 Massachusetts Military Reservation (MMR) Superfund Site, Otis Air National Guard Base, MA.
    1. Andreasen EA, Hahn ME, Heideman W, Peterson RE, Tanguay RL. The zebrafish (Danio rerio) aryl hydrocarbon receptor type 1 is a novel vertebrate receptor. Mol Pharmacol. 2002;62:234–249. - PubMed
    1. Baba T, Mimura J, Nakamura N, Harada N, Yamamoto M, Morohashi K, Fujii-Kuriyama Y. Intrinsic function of the aryl hydrocarbon (dioxin) receptor as a key factor in female reproduction. Mol Cell Biol. 2005;25:10040–10051. - PMC - PubMed
    1. Bailey TL, Elkan C. Fitting a mixture model by expectation maximization to discover motifs in biopolymers. Proc Int Conf Intell Syst Mol Biol. 1994;2:28–36. - PubMed

Publication types

LinkOut - more resources