. 2011 Jul 29;410(5):896-916.
doi: 10.1016/j.jmb.2011.03.054.

T-cell receptor signaling enhances transcriptional elongation from latent HIV proviruses by activating P-TEFb through an ERK-dependent pathway

Affiliations

T-cell receptor signaling enhances transcriptional elongation from latent HIV proviruses by activating P-TEFb through an ERK-dependent pathway

Young Kyeung Kim et al. J Mol Biol. .

Abstract

Latent human immunodeficiency virus (HIV) proviruses are thought to be primarily reactivated in vivo through stimulation of the T-cell receptor (TCR). Activation of the TCR induces multiple signal transduction pathways, leading to the ordered nuclear migration of the HIV transcription initiation factors NF-κB (nuclear factor κB) and NFAT (nuclear factor of activated T-cells), as well as potential effects on HIV transcriptional elongation. We have monitored the kinetics of proviral reactivation using chromatin immunoprecipitation assays to measure changes in the distribution of RNA polymerase II in the HIV provirus. Surprisingly, in contrast to TNF-α (tumor necrosis factor α) activation, where early transcription elongation is highly restricted due to rate-limiting concentrations of Tat, efficient and sustained HIV elongation and positive transcription elongation factor b (P-TEFb) recruitment are detected immediately after the activation of latent proviruses through the TCR. Inhibition of NFAT activation by cyclosporine had no effect on either HIV transcription initiation or elongation. However, examination of P-TEFb complexes by gel-filtration chromatography showed that TCR signaling led to the rapid dissociation of the large inactive P-TEFb:7SK RNP (small nuclear RNA 7SK ribonucleoprotein) complex and the release of active low-molecular-weight P-TEFb complexes. Both P-TEFb recruitment to the HIV long terminal repeat and enhanced HIV processivity were blocked by the ERK (extracellular-signal-regulated kinase) inhibitor U0126, but not by AKT (serine/threonine protein kinase Akt) and PI3K (phosphatidylinositol 3-kinase) inhibitors. In contrast to treatment with HMBA (hexamethylene bisacetamide) and DRB (5,6-dichlorobenzimidazole 1-β-ribofuranoside), which disrupt the large 7SK RNP complex but do not stimulate early HIV elongation, TCR signaling provides the first example of a physiological pathway that can shift the balance between the inactive P-TEFb pool and the active P-TEFb pool and thereby stimulate proviral reactivation.


Figures

Figure 1
Figure 1. Induction of latently infected 2D10 cells by stimulation of the TCR
(A) Analysis of HIV proviral activation by flow cytometry. Cells were activated with 10 ng/ml TNF-α (left panels) or α-CD3 mAb plus α-CD28 mAb (right panels) in the presence or absence of CsA. Note that CsA did not prevent proviral reactivation following TCR signaling. (B) Nuclear protein levels of the NF-κB subunits p65 and p50 and NFAT family members NFATc1 and NFAFc2 were monitored during a 6 hr time course. Western blot of nuclear proteins following stimulation of 2D10 cells with 10 ng/ml TNF-α (left panels) or 0.125 μg/ml α-CD3 mAb plus 1 μg/ml α-CD28 mAb (right panels).
Figure 2
Figure 2. Stimulation of HIV transcriptional elongation following TNF-α stimulation and T cell receptor-mediated activation of latent proviruses
Chromatin immunoprecipitation (ChIP) assays performed using RNAP II antibodies (N-20, Santa Cruz Biotechnology) were used to measure RNAP II distributions on the HIV provirus and the IκBα gene in clone 2D10 cells. (A) HIV transcription. Left panel: RNAP II levels at the transcription start site (HIV +30 to +134 region). Throughout this figure ChIP data sets were fitted to series of overlapping Gaussian distributions as described in the Methods. Middle panel: RNAP II levels at a downstream region (HIV +2593 to +2691). Right Panel: HIV elongation efficiency as measured by the ratio of RNAP II at +2593 and +30. The data was fitted to a biphasic curve. (B) IκBα gene elongation efficiency as measured by the ratio of RNAP II levels at +2038 to +155. Left panel: RNAP II levels near the transcription start site (IκBα +155 to +237 region). Middle panel: RNAP II levels at a downstream region (IκBα +2038 to +2159). Right Panel: IκBα elongation efficiency as measured by the ratio of RNAP II at +2038 and +155. The data was fitted to a straight line. Blue lines and squares: activation of 2D10 cells with 10 ng/ml TNF-α. Red lines and circles: Activation of 2D10 cells with 0.125 μg/ml α-CD3 mAb plus 1 μg/ml α-CD28 mAb. Note that activation through the TCR results in more than twice the amount of RNAP II reaching the downstream regions of the HIV provirus than is seen following activation by TNF-α.
Figure 3
Figure 3. Enhanced recruitment of P-TEFb to HIV proviruses following TCR activation
ChIP assays were used to measure the distribution of RNAP II and CDK9 at multiple locations along the HIV provirus. (A) RNAP II distributions. Left: 2D10 cells induced with 10 ng/ml TNF-α for 30 min (light green circle) and uninduced controls (dark green squares). Right: Cells induced for 30 min with 0.125 μg/ml α-CD3 mAb plus 1 μg/ml α-CD28 mAb (red circles) and uninduced controls (orange squares). (B) CDK9 distributions from the same experiments as shown in panel A. Note that activation of cells through the TCR simultaneously stimulates P-TEFb recruitment and RNAP II elongation, but TNF-α stimulation has only minimal effects on the P-TEFb recruitment.
Figure 4
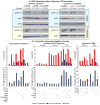
Figure 4. ERK kinase pathway mediates TCR activation of HIV transcriptional elongation
(A) Western blots showing ERK and AKT phosphorylation following TCR activation. Left panels: Suppression of ERK phosphorylation by U0126. 2D10 cells were induced for 30 min with 0.125 μg/ml α-CD3 mAb plus 1 μg/ml α-CD28 mAb in presence or absence of 10 μM U1026 and a combination of 10 μM U0126 and 10 μM LY294002. Nuclear and cytoplasmic extracts were prepared and blotted using antibodies against phosphorylated ERK-1/2 nd phosphorylated AKT (Cell Signaling Technology). The nuclear protein Spt5 was included as a loading control. Right panels: Activation of ERK phosphorylation by LY294002. Cells were induced for 30 min with 0.125 μg/ml α-CD3 mAb plus 1 μg/ml α-CD28 mAb in presence or absence of 10 μM LY294002 and a combination of 10 μM U0126 and 10 μM LY294002 and blotted as described above. (B) Chromatin immunoprecipitation assays to measure the elongation efficiency of RNAP II on induced HIV proviruses. Left panels: 2D10 cells were stimulated for 30 min with 5 ng/ml TNF-α (TNF); 0.125 μg/ml α-CD3 mAb (CD3); 0.125 μg/ml α-CD3 plus 1 μg/ml α-CD28 mAb, CD3 antibody (TCR); 10 μg/ml PHA (PHA); 50 ng/ml PMA (PMA); 50 ng/ml PMA plus 10 μg/ml PHA; 500 nM TSA (TSA); 5 mM HMBA. Center panels: Control 2D10 cells or cells activated with 10 ng/ml TNF-α or 0.125 μg/ml α-CD3 plus 1 μg/ml α-CD28 mAb for 30 min. The cells were pretreated for 1 h as follows: 10 μM LY294002 (LY); 1 μM Akt inhibitor 8 (AI8); 10 μM U0126 (U0126), or 1 μg/ml Cyclosporin A (CsA). Right panels: Cells activated with 10 ng/ml TNF-α (TNF-α) or 50 ng/ml PMA (PMA) for 30 min. The cells were pretreated for 1 h with either 20 μM U0126 or 10 μM LY294002. Red bars: RNAP II levels at the transcription start site (+30 to +134) and downstream region (+4076 to +4172). Blue bars: Elongation efficiency as measured by the ratio of the downstream to upstream RNAP II levels. Broken line indicates the average elongation efficiency of unstimulated or TNF-α stimulated cells. Note that U0126 strongly inhibited stimulation of HIV elongation induced by TCR and PMA stimulation whereas LY294002 enhanced HIV elongation.
Figure 5
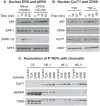
Figure 5. P-TEFb association with chromatin is enhanced following TCR activation in the absence of new P-TEFb subunit synthesis
(A) Western blot showing nuclear levels of p65, ERK-1, phosphorylated ERK-1,2 (pERK-1/2) and Spt5 following TCR activation. Left panels: 2D10 cells were stimulated for up to 60 min with 0.125 μg/ml α-CD3 plus 1 μg/ml α-CD28 mAb, CD3 antibody (TCR). Right panels: Cells stimulated in the presence of 20 μM U0126. Note that TCR stimulation strongly increases the levels of pERK-1/2 but does not alter the total levels of nuclear ERK-1. (B) Western blot showing nuclear levels of p65, CDK9, CycT1 and CDK7 following activation through the TCR (left panels) or by 10 ng/ml TNF-α (right panels). Note that the nuclear levels of CDK9 and CycT1 are unaltered compared to the CDK7 control. (C) TCR signaling enhances the association of P-TEFb with chromatin. 2D10 cells were treated for 60 min with 0.125 μg/ml α-CD3 plus 1 μg/ml α-CD28 mAb, CD3 antibody (TCR), or 100 mM DRB, or 1 μg/ml actinomycin D (Act D). Nuclei were prepared and extracted as described in the Materials and methods. The cytoplasmic and nuclear extracts were examined by Western blotting using antibodies to CycT1, HEXIM1 and CDK9.
Figure 6
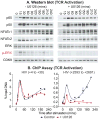
Figure 6. U0126 blocks TCR mediated HIV transcription elongation
(A) Western blot showing accumulation of the transcription factors NF-κB and NFAT in the nucleus after activation of cells with either 0.125 μg/ml α-CD3 mAb plus 1 μg/ml α-CD28 mAb, either in the absence of U0126 or after pretreatment with 10 μM U0126 for 1 h. Included in the blot are analyses of the nuclear levels of ERK 1/2 and phospho-ERK. (B) The distribution of RNAP II on the HIV provirus measured by ChIP assays following TCR activation. U0126 had little effects on RNAP levels upstream (+30 to +134), but it significantly reduced the amount of RNAP downstream (+2593 to 2691).
Figure 7
Figure 7. Recruitment of P-TEFb to HIV proviruses following PMA activation is blocked by U0126 and enhanced by LY294002
ChIP assays were used to measure the distribution of RNAP II and CDK9 at multiple locations along HIV provirus genome. (A) RNAP II distributions. Left: Cells induced for 30 min with 50 ng/ml PMA (red circles), cells induced with PMA in the presence of 20 μM U0126 (yellow triangles) and uninduced controls (black squares). Right: Cells induced for 30 min with 50 ng/ml PMA and 10 μM LY294002 (purple circles), cells induced with PMA and LY294002 in the presence of 20 μM U0126 (light blue triangles) and uninduced controls (dark blue squares). (B) CDK9 distributions from the same experiments as shown in panel A.
Figure 8
Figure 8. TCR signaling induces the disassembly of the 7SK RNP complex
Whole cell lysates were fractionated on Superdex 200 gel filtration columns. Quantitative Western blotting analysis was performed to examine the chromatography profiles of CDK9 (left) and HEXIM-1 (right). Top panels: Western blots. Bottom panels: Elution profiles based on densitometry analysis of the western blots. (A) Disruption of 7SK complexes by TCR signaling. Jurkat 2D10 cells were treated for 30 min with 0.125 μg/ml α-CD3 mAb plus 1 μg/ml α-CD28 mAb. (B) Disruption by 10 mM HMBA, or for 1 h with 100 μM DRB.
Figure 9
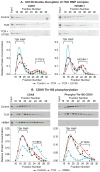
Figure 9. The ERK pathway mediates the disassembly of the 7SK RNP complex in response to TCR activation
Whole cell lysates were fractionated on Superdex 200 gel filtration columns. Quantitative Western blotting analysis was performed to examine the chromatography profiles of CDK9 (left) and HEXIM-1 (right). Top panels: Western blots. Bottom panels: Elution profiles based on densitometry analysis of the western blots. (A) U0126 blocks disruption of the 7SK complex induced by TCR activation. Jurkat 2D10 cells were treated for 30 min with 0.125 μg/ml α-CD3 mAb plus 1 μg/ml α-CD28 mAb with or without 1 h pretreatment with 10 μM U0126. Panel shows Western blotting analysis and chromatography profiles of CDK9 (left) and HEXIM-1 (right). (B) CDK9 present in P-TEFb released by TCR activation remains phosphorylated on the T-loop. Jurkat 2D10 cells were treated for 30 min with either α-CD3/α-CD28 antibodies, or 5 mM HMBA. Panel shows Western blotting analysis and chromatography profiles of CDK9 (left) and phospho-Thr 186 CDK9 (right).
Figure 10
Figure 10. Disruption of the 7SK RNP complex in response to TCR activation occurs in the absence of HIV Tat
(A) Disruption of 7SK RNP complex in Tat minus (2B2D) cells. Whole cell lysates were fractionated on Superdex 200 gel filtration columns and quantitative Western blotting analysis was performed to examine the chromatography profiles of CDK9 (left) and HEXIM-1 (right). Top panels: Western blots. Bottom panels: Elution profiles based on densitometry analysis of the western blots. (B) HIV transcription elongation efficiency. Chip assays were performed as described in legend to Figure 4B. Left panels: 2D10 cells were stimulated for 0.5 hr, 2.5 hr or 10 hr with either 5 ng/ml TNF-α (TNF) or 0.125 μg/ml α-CD3 plus 1 μg/ml α-CD28 mAb, CD3 antibody (TCR). Right panels: 2B2D cells were stimulated for 0.5 hr, 2.5 hr or 10 hr with either 5 ng/ml TNF-α (TNF) or 0.125 μg/ml α-CD3 plus 1 μg/ml α-CD28 mAb, CD3 antibody (TCR). Top panels, red bars: RNAP II levels at the transcription start site (+30 to +134). Top panels, black bars: downstream region (+4076 to +4172). Bottom panels, blue bars: Elongation efficiency as measured by the ratio of the downstream to upstream RNAP II levels. Broken line indicates the average elongation efficiency of unstimulated or TNF-α stimulated cells.

References

    1. Pierson T, McArthur J, Siliciano RF. Reservoirs for HIV-1: mechanisms for viral persistence in the presence of antiviral immune responses and antiretroviral therapy. Annu Rev Immunol. 2000;18:665–708. - PubMed
    1. Coiras M, Lopez-Huertas MR, Perez-Olmeda M, Alcami J. Understanding HIV-1 latency provides clues for the eradication of long-term reservoirs. Nat Rev Microbiol. 2009;7:798–812. - PubMed
    1. Alexaki A, Liu Y, Wigdahl B. Cellular reservoirs of HIV-1 and their role in viral persistence. Curr HIV Res. 2008;6:388–400. - PMC - PubMed
    1. Chun TW, Davey RT, Jr, Engel D, Lane HC, Fauci AS. Re-emergence of HIV after stopping therapy. Nature. 1999;401:874–5. - PubMed
    1. Davey RT, Jr, Bhat N, Yoder C, Chun TW, Metcalf JA, Dewar R, Natarajan V, Lempicki RA, Adelsberger JW, Miller KD, Kovacs JA, Polis MA, Walker RE, Falloon J, Masur H, Gee D, Baseler M, Dimitrov DS, Fauci AS, Lane HC. HIV-1 and T cell dynamics after interruption of highly active antiretroviral therapy (HAART) in patients with a history of sustained viral suppression. Proc Natl Acad Sci U S A. 1999;96:15109–14. - PMC - PubMed

Publication types

MeSH terms