. 2011 Sep;179(3):1405-14.
doi: 10.1016/j.ajpath.2011.05.050. Epub 2011 Jul 18.

Overexpression of pyruvate dehydrogenase kinase 3 increases drug resistance and early recurrence in colon cancer

Affiliations

Overexpression of pyruvate dehydrogenase kinase 3 increases drug resistance and early recurrence in colon cancer

Chun-Wun Lu et al. Am J Pathol. 2011 Sep.

Abstract

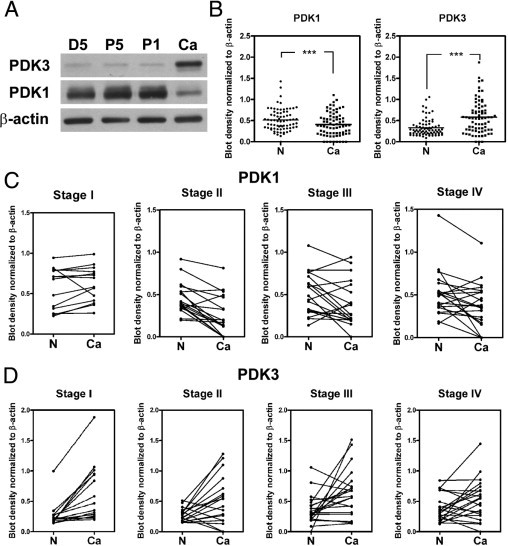
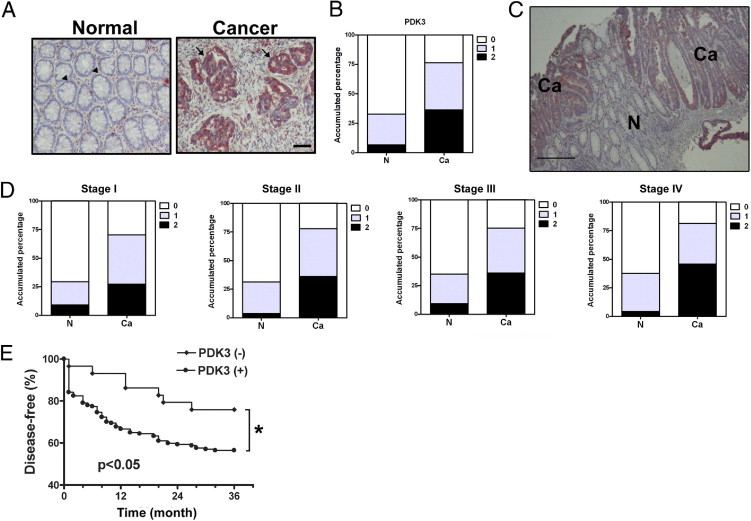
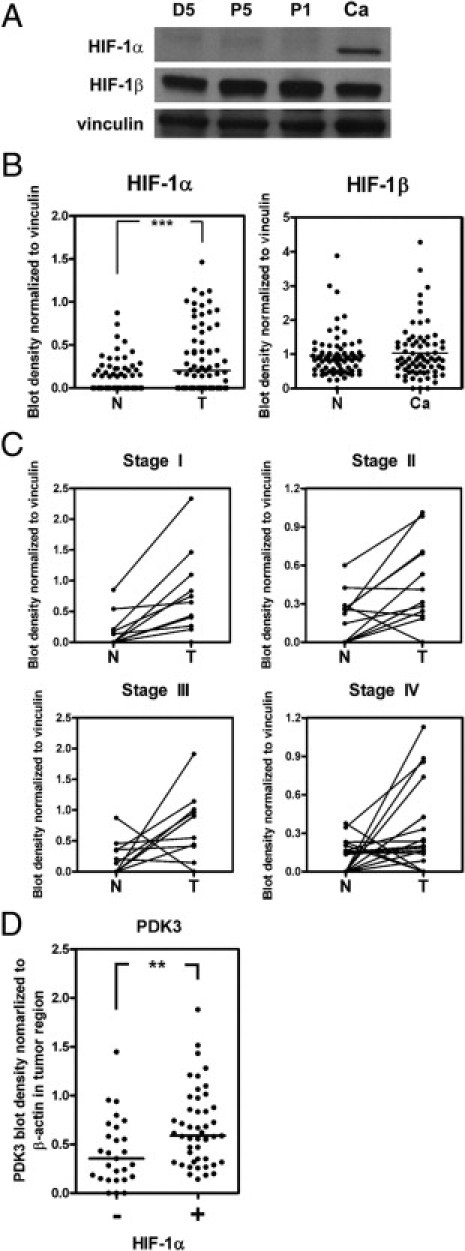
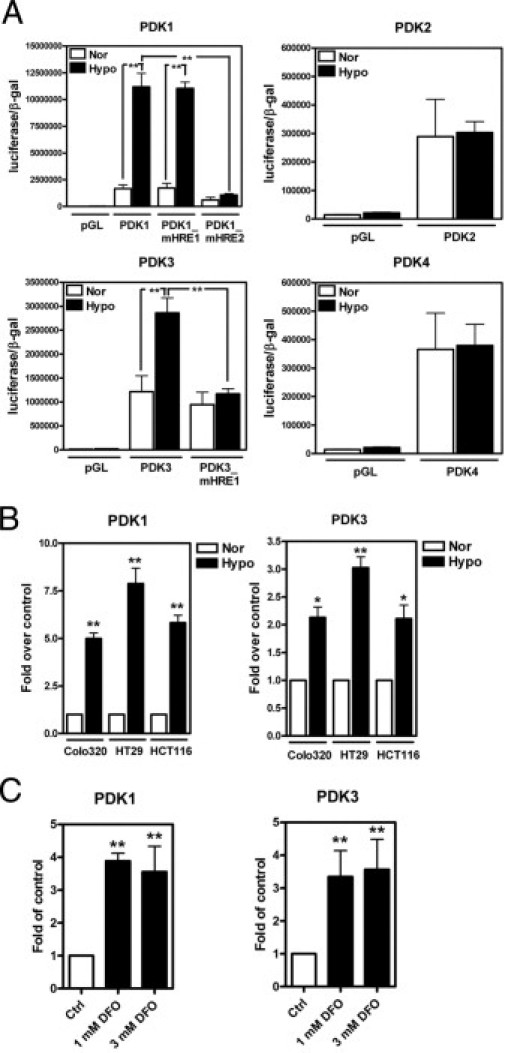
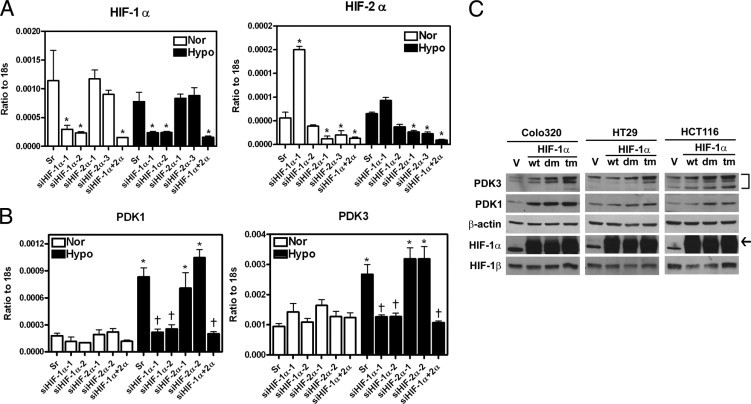
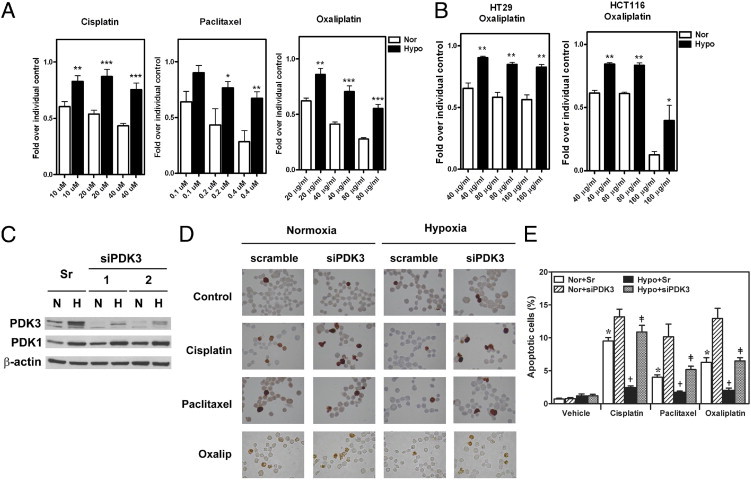
The switch of cellular metabolism from mitochondrial respiration to glycolysis is the hallmark of cancer cells and is associated with tumor malignancy. Pyruvate dehydrogenase kinase-1 (PDK1) and PDK3 participate in the metabolic switch of cancer cells; however, the medical significance of PDK1 and PDK3 in cancer progression is not known. Here, we assessed the expression profiles of PDK1 and PDK3 in colorectal cancer. Western blot analysis (n = 74) demonstrated that PDK3 was markedly increased in colon cancer compared to that in adjacent normal tissues, whereas PDK1 was decreased in cancer cells. In addition, PDK3 expression was positively correlated with that of hypoxia inducible factor-1α (HIF-1α) in cancer cells. Further analysis using immunohistochemical staining revealed that PDK3 levels were positively associated with severity of cancer and negatively associated with disease-free survival. In vitro studies using several colon cancer cell lines showed that PDK3 expression was controlled by HIF-1α and contributed to hypoxia-induced increased drug resistance, perhaps explaining why patients with PDK3 overexpression have a greater incidence of treatment failure. Taken together, our findings suggest that PDK3 plays an important role in the metabolic switch and drug resistance of colon cancer and is potentially a novel target for cancer therapy.


Figures

Figure 1
Figure 1
PDK3 is overexpressed in colon cancer. A: Representative Western blot shows the levels of PDK1 and PDK3 in four different tissues collected from the same individual. D5: 5 cm distal of tumor; P5 and P1: 5 cm and 1 cm proximal of tumor, respectively; Ca, cancer. B: Levels of PDK1 and PDK3 in 74 paired normal (N) and colon cancer (Ca) tissues detected by Western blot analysis. The bar indicates the medium of the ratio. ***P < 0.001. C and D: The levels of PDK1 (C) and PDK3 (D) in paired normal (N) and cancer regions in each stage of cancer. Stage I, n = 15; stage II, n = 18; stage III, n = 20; stage IV, n = 21. P values were calculated by paired t-test. For PDK1, stage I: P = 0.2514; stage II: P < 0.001; stage III: P = 0.037; stage IV: P = 0.024. For PDK3, stage I: P < 0.001; stage II: P = 0.014; stage III: P = 0.012; stage IV: P = 0.049.
Figure 2
Figure 2
Overexpression of PDK3 in colon cancer is associated with early recurrence. The level of PDK3 in 275 patients' tissues was evaluated by immunohistochemical staining. A: Representative pictures show immunoreactivity of PDK3 in normal (N) and cancerous (Ca) of tissues from one patient. Scale bar = 100 μm. Arrowheads indicate normal epithelial cells with PDK3-negative staining; Arrows indicate cancerous epithelial cells with PDK3 positive staining. B: Accumulated percentage of PDK3 immunoreactivity in normal or cancer regions of 275 samples. The staining intensity of PDK3 was scored from 0 to 2. 0: no positive signal; 1: >50% of cells with weak staining; and 2: >50% of cells with strong staining. C: A representative figure shows the staining of PDK3 in the normal (N) and cancerous (Ca) part within the same tissue section. Scale bar = 200 μm. D: Percentage of PDK3 staining intensity in each stage. Stage I, n = 44; stage II, n = 86; stage III, n = 97; stage IV, n = 48. E: Figure shows percentage of patients with recurrent cancer after surgery and treatment within 3 years. Only patients who had been followed up for at least 36 months were included in this analysis. Numbers of patients analyzed were: PDK3 (+): 177, PDK3 (−): 29. *P < 0.05 by Kaplan-Meier analytic method.
Figure 3
Figure 3
Elevation of PDK3 is positively correlated with increased HIF-1α level in colon cancer. A: Representative Western blot shows the levels of HIF-1α, HIF-1β, and vinculin in four different tissues collected from the same individual. D5: 5 cm distal of cancer region; P5 and P1: 5 cm and 1 cm proximal of cancer, respectively; Ca, cancer. B:Levels of HIF-1α and HIF-1β in 74 paired normal (N) and colon cancer (Ca) tissues detected by Western blot analysis. The bar indicates the medium of blot density. ***P < 0.001. C: The levels of HIF-1α in paired normal (N) and cancer (Ca) regions in each stage of cancer. Stage I, n = 15; stage II, n = 18; stage III, n = 20; stage IV, n = 21. P values were calculated by paired t-test. Stage I: P = 0.01; stage II: P = 0.013; stage III: P = 0.037; stage IV: P = 0.029. D: The ratios (cancer to normal) of PDK3 determined by Western blot analysis were shown according to the presence or absence of HIF-1α. Forty-seven HIF-1α–positive (+) and 27 HIF-1α–negative (−) samples were analyzed. **P < 0.01, calculated by paired t-test.
Figure 4
Figure 4
PDK1 and PDK3 are induced by hypoxia in colorectal cancer cell lines. A: Colo320DM cells were transiently transfected with control plasmid (pGL), one of the PDK1, -2, -3, and -4 promoter reporter constructs, and an internal control plasmid containing β-galactosidase (β-gal) and then cultured under normoxia (21% O2, Nor) or hypoxia (1% O2, Hypo) for 24 hours. The promoter activity was shown as luciferase activity normalized to the β-gal. Data are shown as the mean and SEM from three independent experiments performed in duplicate. HRE, hypoxia response element; mHRE, mutant HRE that prevents HIF-1 binding. B and C: Colorectal cancer cell lines were cultured under normoxic or hypoxic condition (B) or treated with different doses of desferrioxamine (DFO) under normoxic condition (C) for 16 hours. The levels of PDK1 and PDK3 were determined by real-time RT-PCR, and all values were normalized to the control normoxic group. Data show mean and SEM from three independent experiments. *P < 0.05, **P < 0.01.
Figure 5
Figure 5
Expression of PDK1 and PDK3 are up-regulated by HIF-1α, but not HIF-2α. A: Several different siRNAs against HIF-1α (siHIF-1α-1 and -2) or HIF-2α (siHIF-2α-1 and -3) and GC content–matched scramble control (Sr) were transiently transfected into colo320 DM cells. After 6 hours, cells were incubated at normoxic or hypoxic condition for 24 hours. The levels of HIF-1α and HIF-2α were quantified by real-time RT-PCR, and all values were normalized to 18s ribosomal RNA (18s). Data show mean and SEM for three independent experiments. B: Data show means and SEM of PDK1 and PDK3 transcripts in HIF-1α and/or HIF-2α knockdown cells from three independent experiments. *P < 0.05 compared to the same siRNA-treated normoxia group, P < 0.05 compared to hypoxia scramble siRNA-treated group. C: Three colon cancer cell lines, colo320DM, HT29, and HCT116, were force expressed with pcDNA control vector (V), wild type (wt), double-mutated (dm, P402A/P564A), and triple-mutated (tm, P402A/P564A/N803A) HIF-1α expression plasmids and incubated in normoxia for 24 hours. The levels of PDK3, PDK1, HIF-1α, and HIF-1β were determined by Western blot analysis. Arrow indicates the specific HIF-1α band.
Figure 6
Figure 6
PDK3 mediates HIF-1α–induced drug resistance in colon cancer cells. A: Colo320DM cells were cultured under normoxic (Nor) or hypoxic (Hypo) condition with different doses of cisplatin, paclitaxel, or oxaliplatin as indicated for 24 hours. Cell numbers were determined by crystal violet staining. Data show means and SEM of three independent experiments. *P < 0.05; **P < 0.01; ***P < 0.001. B: HCT116 and HT29 cells were cultured under normoxic (Nor) or hypoxic (Hypo) condition and treated with different doses of oxaliplatin for 24 hours as described in panel A. *P < 0.05, **P < 0.01. C: Representative Western blot shows the knockdown effect of siRNA against PDK3. Levels of PDK1 and β-actin were also detected to demonstrate the specificity of siRNA. sr: GC content–matched scramble siRNA. hypoxia, H; N, normoxia. D and E: Colo320DM cells were transiently transfected with siPDK3 or GC content–matched scramble siRNA (Sr) and followed by treatment with 40 μmol/L cisplatin, 0.4 μmol/L paclitaxel, or 40 μg/mL oxaliplatin under normoxic or hypoxic condition for 24 hours. Representative figures of TUNEL assay results were shown in panel D and the percentages of apoptotic cells in each treatment were shown in panel E. *P < 0.05 compared to normoxia, scramble RNAi, and vehicle-treated groups; P < 0.05 compared to normoxia, scramble RNAi, and drug-treated groups; P < 0.05 compared to hypoxia, scramble RNAi, and drug-treated groups.

References

    1. Wolpin B.M., Mayer R.J. Systemic treatment of colorectal cancer. Gastroenterology. 2008;134:1296–1310. - PMC - PubMed
    1. Warburg O. The Metabolism of Tumours: Investigations from the Kaiser Wilhelm Institute for Biology. In: Warburg O., editor. Constable & Co., Ltd; London: 1930. p. 327.
    1. Kondoh H. Cellular life span and the Warburg effect. Exp Cell Res. 2008;314:1923–1928. - PubMed
    1. Gillies R.J., Raghunand N., Garcia-Martin M.L., Gatenby R.A. pH imaging: A review of pH measurement methods and applications in cancers. IEEE Eng Med Biol Mag. 2004;23:57–64. - PubMed
    1. Gillies R.J., Raghunand N., Karczmar G.S., Bhujwalla Z.M. MRI of the tumor microenvironment. J Magn Reson Imaging. 2002;16:430–450. - PubMed

Publication types

MeSH terms

Substances