. 2011 Oct;107(1):147-55.
doi: 10.1016/j.pbiomolbio.2011.06.014. Epub 2011 Jul 7.

Patient-specific modeling of dyssynchronous heart failure: a case study

Affiliations

Patient-specific modeling of dyssynchronous heart failure: a case study

Jazmin Aguado-Sierra et al. Prog Biophys Mol Biol. 2011 Oct.

Abstract

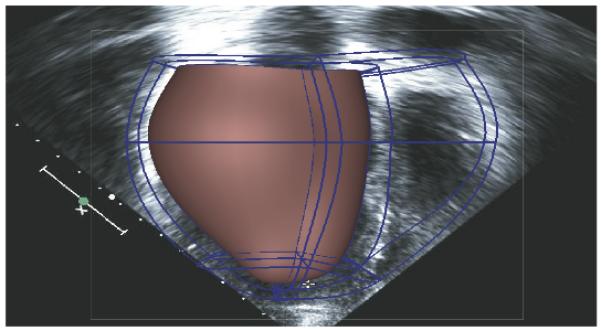
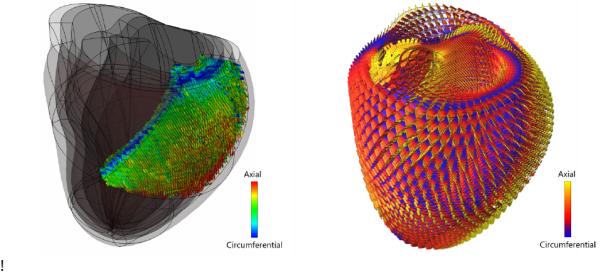
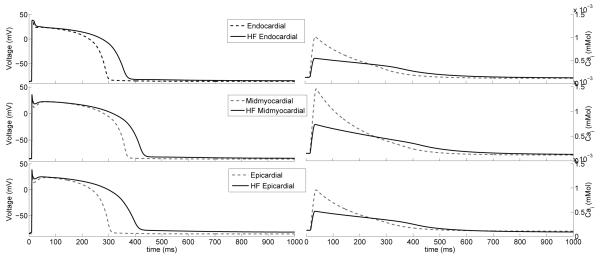
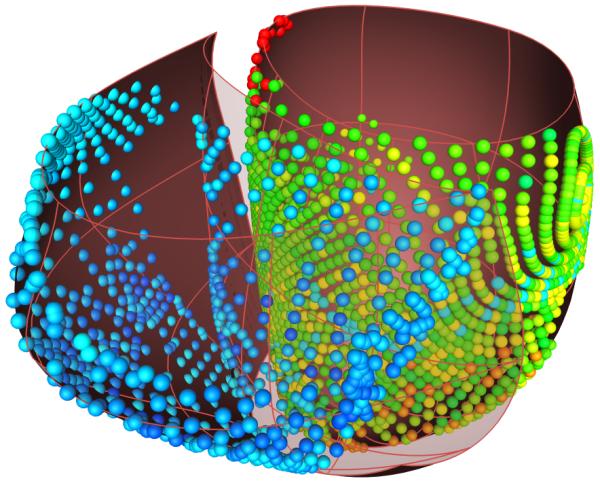
The development and clinical use of patient-specific models of the heart is now a feasible goal. Models have the potential to aid in diagnosis and support decision-making in clinical cardiology. Several groups are now working on developing multi-scale models of the heart for understanding therapeutic mechanisms and better predicting clinical outcomes of interventions such as cardiac resynchronization therapy. Here we describe the methodology for generating a patient-specific model of the failing heart with a myocardial infarct and left ventricular bundle branch block. We discuss some of the remaining challenges in developing reliable patient-specific models of cardiac electromechanical activity, and identify some of the main areas for focusing future research efforts. Key challenges include: efficiently generating accurate patient-specific geometric meshes and mapping regional myofiber architecture to them; modeling electrical activation patterns based on cellular alterations in human heart failure, and estimating regional tissue conductivities based on clinically available electrocardiographic recordings; estimating unloaded ventricular reference geometry and material properties for biomechanical simulations; and parameterizing systemic models of circulatory dynamics from available hemodynamic measurements.


Figures

Figure 1
Figure 1
Compact high-order cubic Hermite finite element mesh fitted to echocardiographic recordings of left and right ventricular shape in a patient with congestive heart failure.
Figure 2
Figure 2
Left: Partial reconstruction of an ex vivo human DTMRI scan. The data has been aligned to a cubic Hermite finite element mesh that has been fitted to the anatomy of the same ex vivo heart. Right: Glyph representation of a trilinear interpolation of the complete ex vivo DTMRI dataset throughout the entire heart using the Log-Euclidian tensor metric (Fillard et al., 2007a) that allows for fast computations and interpolation without tensor distortion or swelling.
Figure 3
Figure 3
Endocardial, midmyocardial and epicardial myocytes action potentials (left) and calcium transients (right) of the normal (dotted line) (ten Tusscher et al., 2004) and failing (solid line) single cell.
Figure 4
Figure 4
Electroanatomic map measurements of LBBB (left) projected to the end-diastolic mesh and resulting activation times (right) from the computational model [ms]. Red indicates the latest activated region, coinciding with the basal location of a scar.
Figure 4
Figure 4
Electroanatomic map measurements of LBBB (left) projected to the end-diastolic mesh and resulting activation times (right) from the computational model [ms]. Red indicates the latest activated region, coinciding with the basal location of a scar.
Figure 4
Figure 4
Electroanatomic map measurements of LBBB (left) projected to the end-diastolic mesh and resulting activation times (right) from the computational model [ms]. Red indicates the latest activated region, coinciding with the basal location of a scar.
Figure 5
Figure 5
(A) End-diastolic geometry fitted from imaging data and unloaded geometry inflated to end-diastolic LV and RV pressures. (B) Displacement between the two meshes.
Figure 5
Figure 5
(A) End-diastolic geometry fitted from imaging data and unloaded geometry inflated to end-diastolic LV and RV pressures. (B) Displacement between the two meshes.
Figure 6
Figure 6
Illustration of the E DPVR (end-diastolic pressure volume relationship) from the patient-specific model and the Klotz curve. The end-diastolic volume (EDV, 161 ml) and end-diastolic pressure (EDP, 23 mmHg) were measured in the patient.
Figure 7
Figure 7
(A) Left and Right ventricular pressure tracings computed by the model and measured. (B) Model-predicted left and right ventricular pressure-volume loops. (C) Long-axis sectional view of bi-ventricular model at 4 cardiac phases: end-diastole (ED), aortic valve opening (AVO), aortic valve closure (AVC), mitral valve opening (MVO). Fiber strain with respect to end-diastole is rendered in color from −0.15 (blue) to +0.15 (red). Note end-systolic bulging in region of inferior infarct labeled with *.
Figure 7
Figure 7
(A) Left and Right ventricular pressure tracings computed by the model and measured. (B) Model-predicted left and right ventricular pressure-volume loops. (C) Long-axis sectional view of bi-ventricular model at 4 cardiac phases: end-diastole (ED), aortic valve opening (AVO), aortic valve closure (AVC), mitral valve opening (MVO). Fiber strain with respect to end-diastole is rendered in color from −0.15 (blue) to +0.15 (red). Note end-systolic bulging in region of inferior infarct labeled with *.

References

    1. Alastrué V, Martínez MA, Doblaré M. Modelling adaptative volumetric finite growth in patient-specific residually stressed arteries. Journal of Biomechanics. 2008;41:1773–1781. - PubMed
    1. Arsigny V, Fillard P, Pennec X, Ayache N. Log-Euclidian metrics for fast and simple calculus on diffusion tensors. Magnetic Reonance in Medicine. 2006;56:411–421. - PubMed
    1. Arts T, Delhaas T, Bovendeerd P, Verbeek X, Prinzen FW. Adaptation to mechanical load determines shape and properties of heart and circulation: the CircAdapt model. American Journal of Physiology-Heart and Circulatory Physiology. 2005;288:H1943–H1954. - PubMed
    1. Arts T, Lumens J, Kroon W, Donker D, Prinzen F, Delhaas T. Patient-Specific Modeling of Cardiovascular Dynamics with a Major Role for Adaptation. In: Kerckhoffs RCP, editor. Patient-Specific Modeling of the Cardiovascular System. Springer; New York: 2010. pp. 21–41.
    1. Boemser P, Ranke O. Ueber die messung des schlagvolume des herzens auf unglutigem. Weg. Zeitung fuer Biologie. 1930;90:467–507.

Publication types