

Feasibility of a method for en face imaging of photoreceptor cell integrity
- PMID: 21764030
- PMCID: PMC3200461
- DOI: 10.1016/j.ajo.2011.04.027
Feasibility of a method for en face imaging of photoreceptor cell integrity
Abstract
Purpose: To report a method for en face imaging of the photoreceptor inner and outer segment junction by spectral-domain optical coherence tomography (SD OCT) and to describe findings in normal subjects and patients with various retinal diseases.
Design: Observational case series.
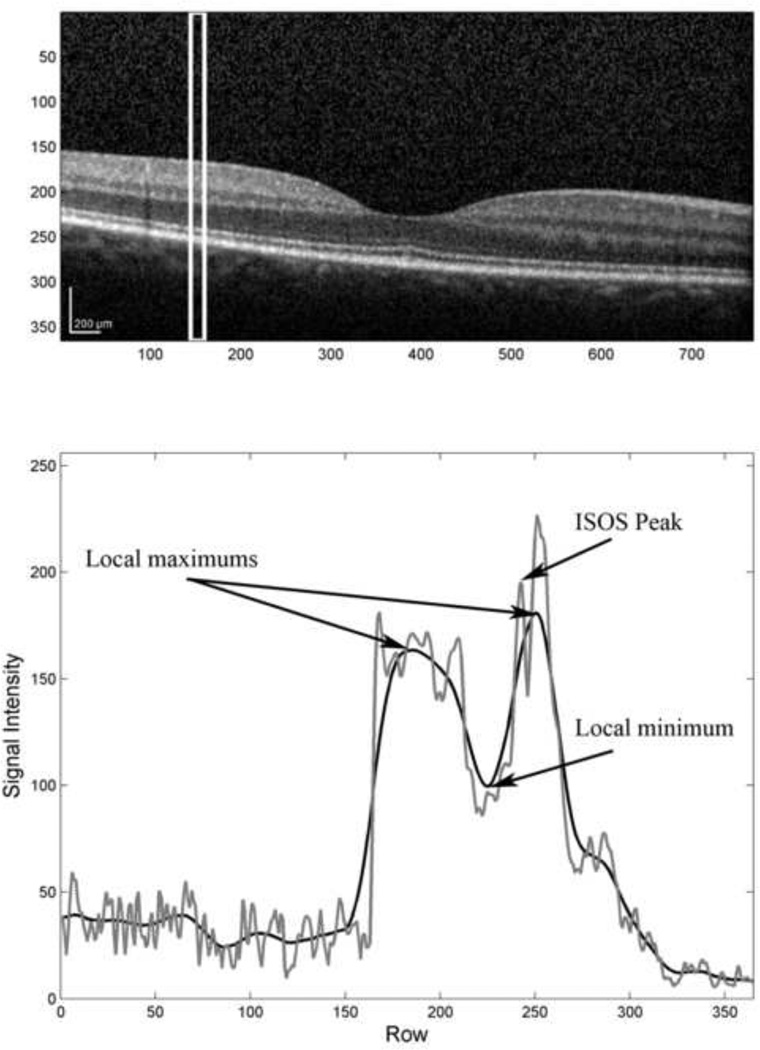
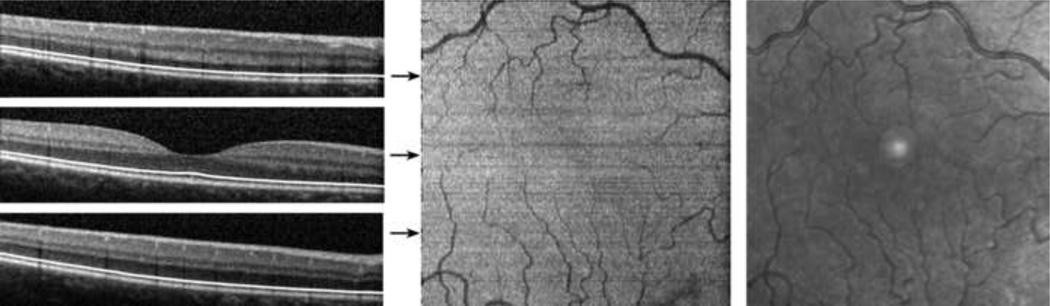
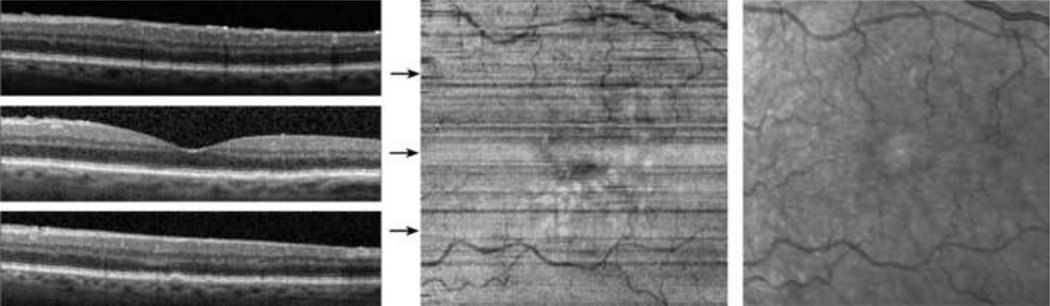
Methods: SD OCT images were acquired from 6 normal subjects (mean age, 44 ± 11 years) and from 5 subjects with retinal diseases (mean age, 66 ± 22 years). A customized high-density SD OCT volume scan was acquired on the retina. SD OCT B-scan images were segmented automatically to extract intensity data along the inner and outer segment junction. Data obtained from the raster B-scans were combined to generate an inner and outer segment en face image in a 4.4 × 4.4-mm retinal area centered on the fovea. The foveal-to-parafoveal mean intensity ratio was measured, and repeatability was determined. An infrared scanning laser ophthalmoscope image was acquired and was cropped to provide a field of view similar to the inner and outer segment en face image.
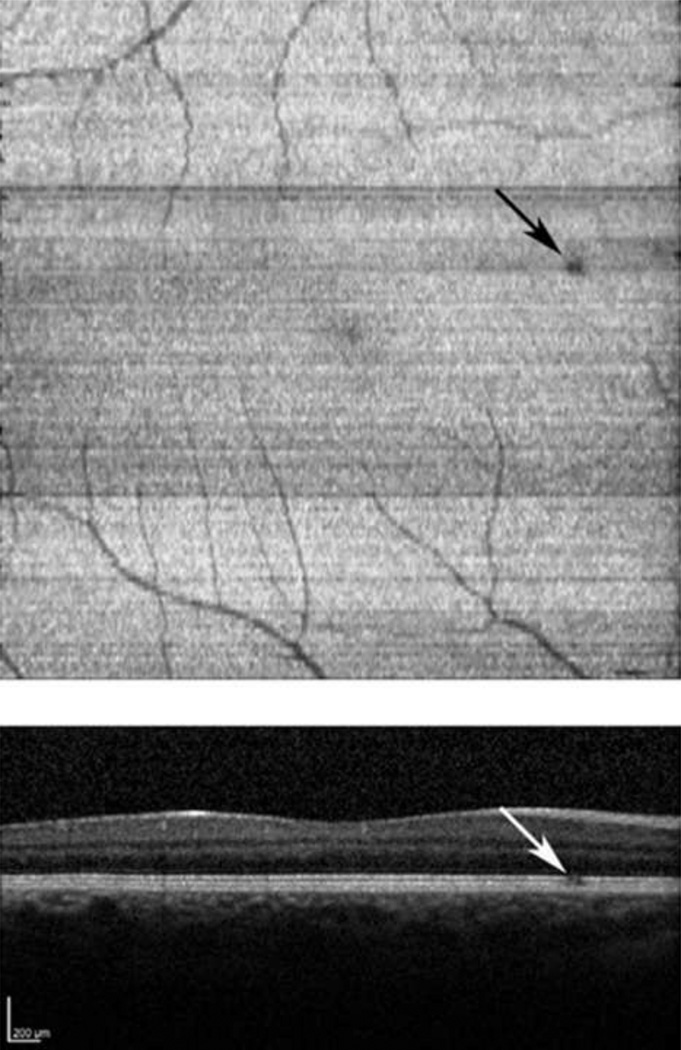
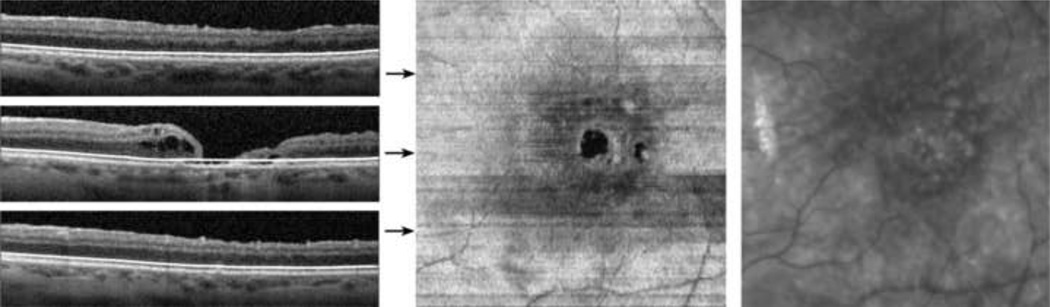
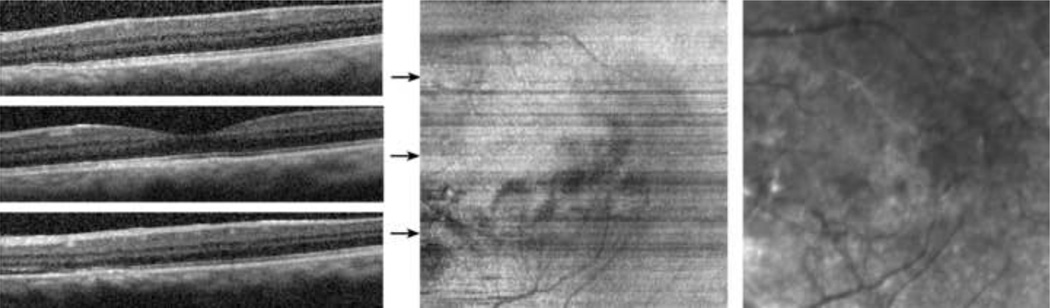
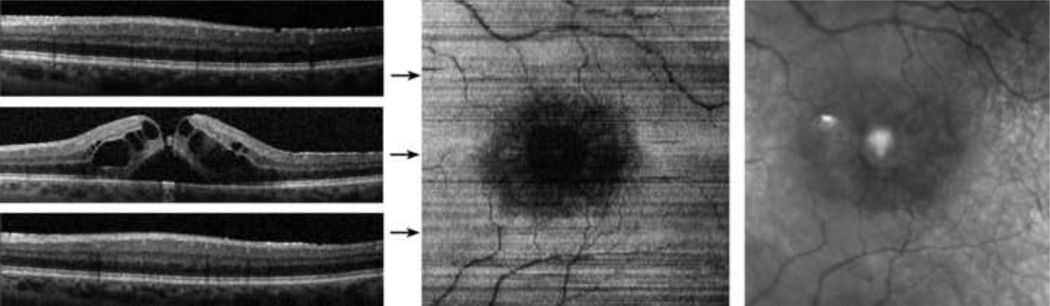
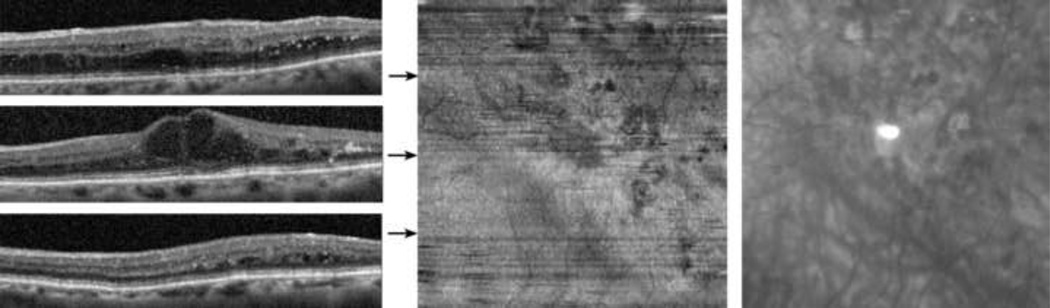
Results: Inner and outer segment en face images generated in normal subjects provided clear visualization of the retinal vasculature, matching the vascular network observed in the infrared scanning laser ophthalmoscope image. In normal subjects, the foveal-to-parafoveal mean intensity ratio was 0.88 ± 0.06, and repeatability of measurements was, on average, 7%. In macular hole, a dark circular region was observed in the inner and outer segment en face image, indicative of photoreceptor cell loss. In age-related macular degeneration, the en face image displayed nonuniform texture corresponding to topographic variations in the inner and outer segment junction. In central serous retinopathy, areas of lower intensity were visible on the en face image corresponding to regions of prior neurosensory elevation. In cystoid macular edema, reduced intensity was present in the inner and outer segment en face image in areas with increased retinal thickness. In diabetic retinopathy, the inner and outer segment en face image displayed regions of reduced intensity resulting from edema, laser scars, or both.
Conclusions: Detection of intensity abnormalities in the inner and outer segment en face image is useful for monitoring the integrity of photoreceptor cells in the course of disease progression and therapeutic intervention.
Copyright © 2011 Elsevier Inc. All rights reserved.
Figures
References
-
- Drexler W, Sattmann H, Hermann B, et al. Enhanced visualization of macular pathology with the use of ultrahigh-resolution optical coherence tomography. Arch Ophthalmol. 2003;121(5):695–706. - PubMed
-
- Gloesmann M, Hermann B, Schubert C, Sattmann H, Ahnelt PK, Drexler W. Histologic correlation of pig retina radial stratification with ultrahigh-resolution optical coherence tomography. Invest Ophthalmol Vis Sci. 2003;44(4):1696–1703. - PubMed
-
- Costa RA, Calucci D, Skaf M, et al. Optical coherence tomography 3: Automatic delineation of the outer neural retinal boundary and its influence on retinal thickness measurements. Invest Ophthalmol Vis Sci. 2004;45(7):2399–2406. - PubMed
-
- Sandberg MA, Brockhurst RJ, Gaudio AR, Berson EL. The association between visual acuity and central retinal thickness in retinitis pigmentosa. Invest Ophthalmol Vis Sci. 2005;46(9):3349–3354. - PubMed
Publication types
MeSH terms
Grants and funding
LinkOut - more resources
Full Text Sources
Medical
Research Materials
