

Phylomedicine: an evolutionary telescope to explore and diagnose the universe of disease mutations
- PMID: 21764165
- PMCID: PMC3272884
- DOI: 10.1016/j.tig.2011.06.004
Phylomedicine: an evolutionary telescope to explore and diagnose the universe of disease mutations
Abstract
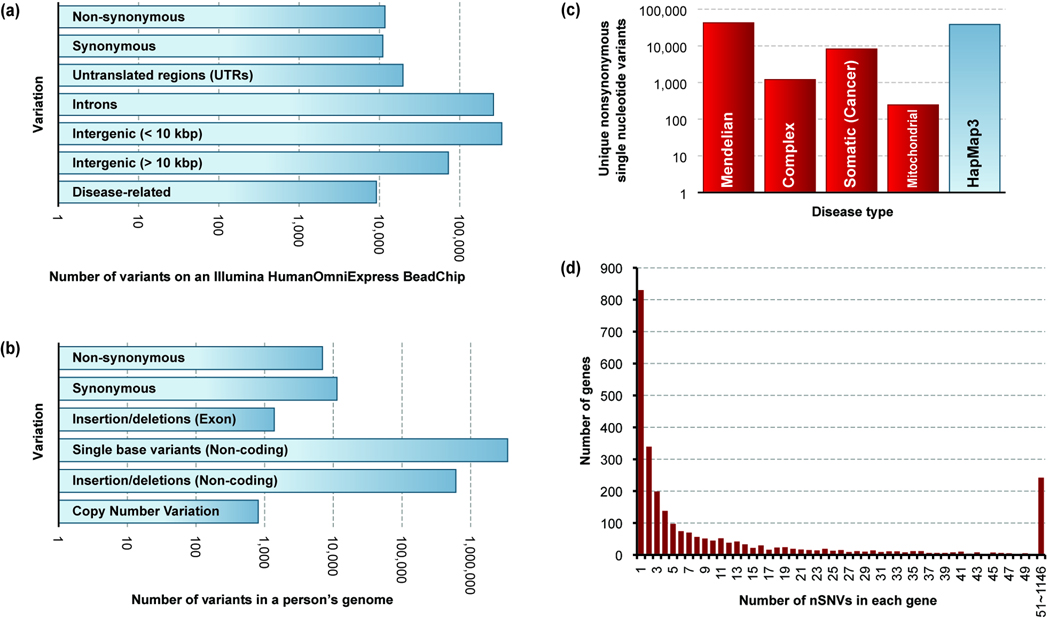
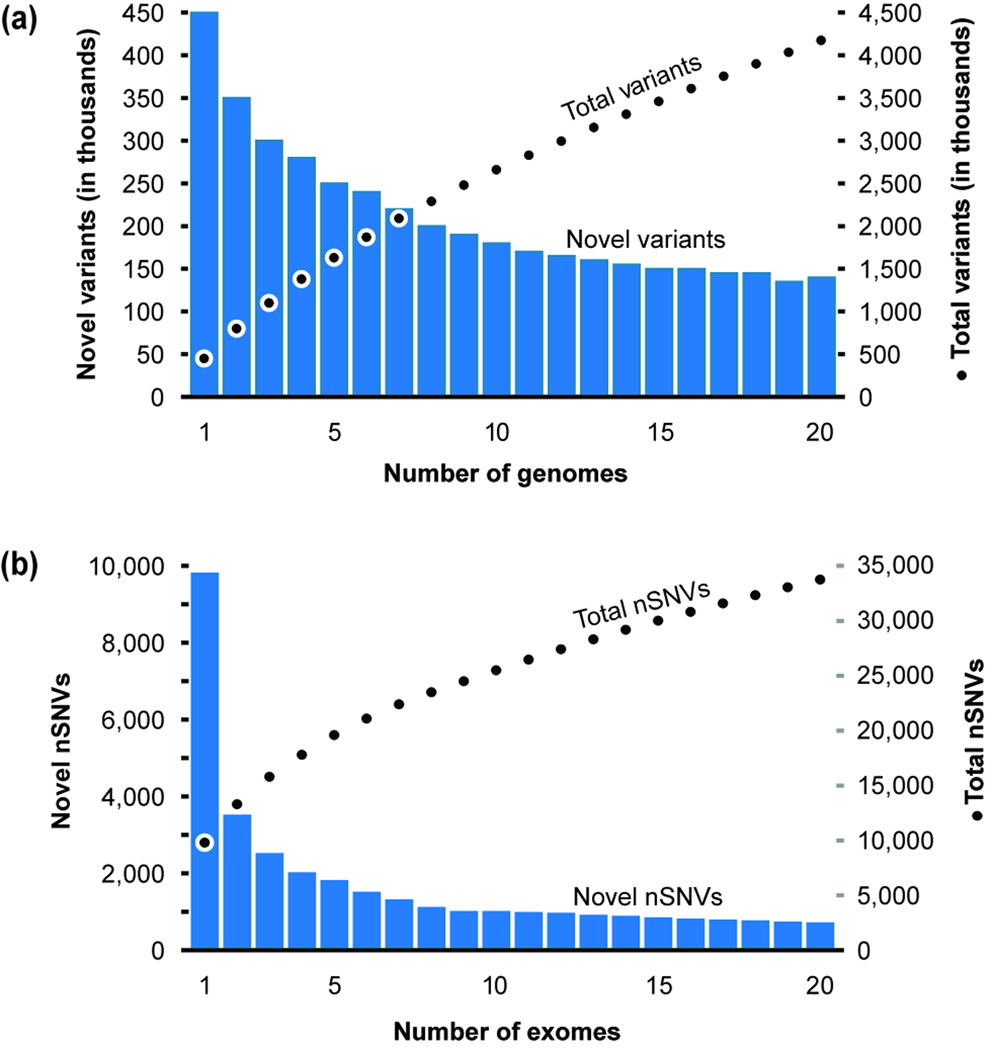
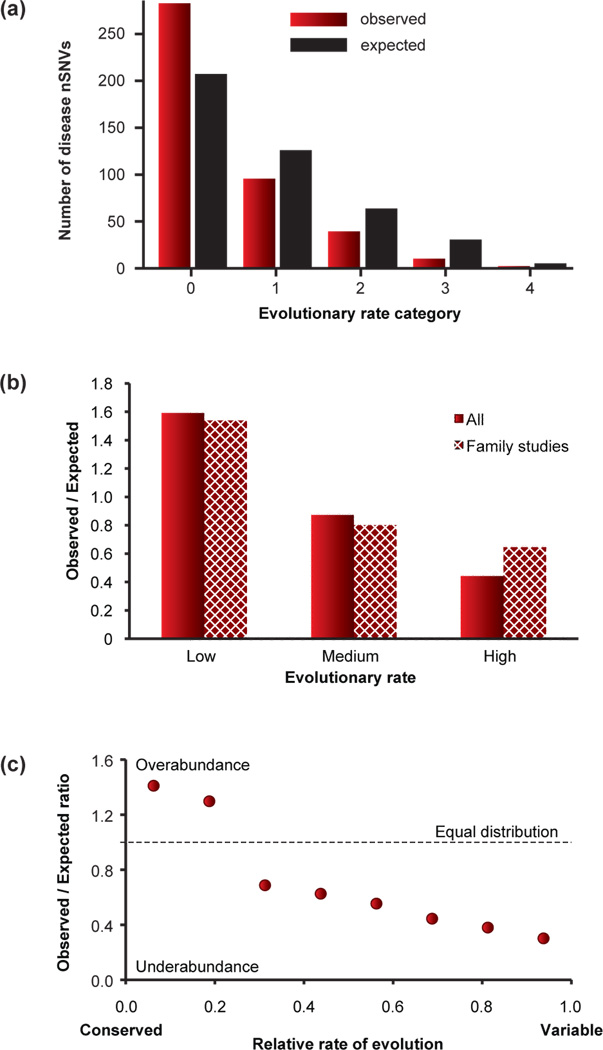
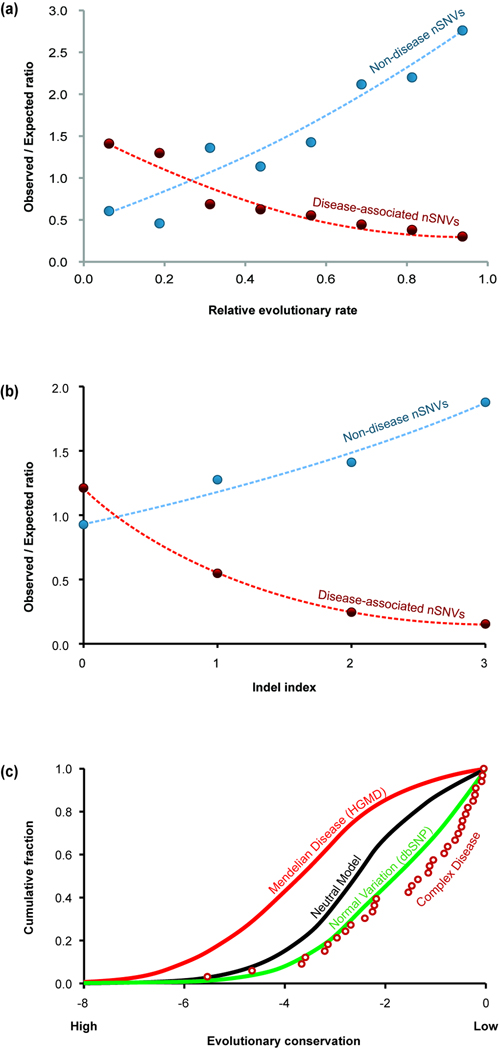
Modern technologies have made the sequencing of personal genomes routine. They have revealed thousands of nonsynonymous (amino acid altering) single nucleotide variants (nSNVs) of protein-coding DNA per genome. What do these variants foretell about an individual's predisposition to diseases? The experimental technologies required to carry out such evaluations at a genomic scale are not yet available. Fortunately, the process of natural selection has lent us an almost infinite set of tests in nature. During long-term evolution, new mutations and existing variations have been evaluated for their biological consequences in countless species, and outcomes are readily revealed by multispecies genome comparisons. We review studies that have investigated evolutionary characteristics and in silico functional diagnoses of nSNVs found in thousands of disease-associated genes. We conclude that the patterns of long-term evolutionary conservation and permissible sequence divergence are essential and instructive modalities for functional assessment of human genetic variations.
Published by Elsevier Ltd.
Figures
Similar articles
-
Positional conservation and amino acids shape the correct diagnosis and population frequencies of benign and damaging personal amino acid mutations.Genome Res. 2009 Sep;19(9):1562-9. doi: 10.1101/gr.091991.109. Epub 2009 Jun 22. Genome Res. 2009. PMID: 19546171 Free PMC article.
-
Genomics and medicine. Dissecting human disease in the postgenomic era.Science. 2001 Feb 16;291(5507):1224-9. doi: 10.1126/science.291.5507.1224. Science. 2001. PMID: 11233446 No abstract available.
-
Evolutionary anatomies of positions and types of disease-associated and neutral amino acid mutations in the human genome.BMC Genomics. 2006 Dec 5;7:306. doi: 10.1186/1471-2164-7-306. BMC Genomics. 2006. PMID: 17144929 Free PMC article.
-
Where genotype is not predictive of phenotype: towards an understanding of the molecular basis of reduced penetrance in human inherited disease.Hum Genet. 2013 Oct;132(10):1077-130. doi: 10.1007/s00439-013-1331-2. Epub 2013 Jul 3. Hum Genet. 2013. PMID: 23820649 Free PMC article. Review.
-
Gene and Variant Annotation for Mendelian Disorders in the Era of Advanced Sequencing Technologies.Annu Rev Genomics Hum Genet. 2017 Aug 31;18:229-256. doi: 10.1146/annurev-genom-083115-022545. Epub 2017 Apr 17. Annu Rev Genomics Hum Genet. 2017. PMID: 28415856 Review.
Cited by
-
Coevolving residues inform protein dynamics profiles and disease susceptibility of nSNVs.PLoS Comput Biol. 2018 Nov 29;14(11):e1006626. doi: 10.1371/journal.pcbi.1006626. eCollection 2018 Nov. PLoS Comput Biol. 2018. PMID: 30496278 Free PMC article.
-
Dynamics-based protein network features accurately discriminate neutral and rheostat positions.Biophys J. 2024 Oct 15;123(20):3612-3626. doi: 10.1016/j.bpj.2024.09.013. Epub 2024 Sep 13. Biophys J. 2024. PMID: 39277794
-
Bioinformatics for personal genome interpretation.Brief Bioinform. 2012 Jul;13(4):495-512. doi: 10.1093/bib/bbr070. Epub 2012 Jan 13. Brief Bioinform. 2012. PMID: 22247263 Free PMC article. Review.
-
The Role of Conformational Dynamics and Allostery in the Disease Development of Human Ferritin.Biophys J. 2015 Sep 15;109(6):1273-81. doi: 10.1016/j.bpj.2015.06.060. Epub 2015 Aug 6. Biophys J. 2015. PMID: 26255589 Free PMC article.
-
Next generation exome sequencing of paediatric inflammatory bowel disease patients identifies rare and novel variants in candidate genes.Gut. 2013 Jul;62(7):977-84. doi: 10.1136/gutjnl-2011-301833. Epub 2012 Apr 28. Gut. 2013. PMID: 22543157 Free PMC article.
References
-
- Hindorff LA, et al. A Catalog of Published Genome-Wide Association Studies. 2011 www.genome.gov/gwastudies.
-
- McCarthy MI, et al. Genome-wide association studies for complex traits: consensus, uncertainty and challenges. Nat Rev Genet. 2008;9:356–369. - PubMed
Publication types
MeSH terms
Grants and funding
LinkOut - more resources
Full Text Sources
Other Literature Sources
Medical
