. 2011 Jul 15;333(6040):312-6.
doi: 10.1126/science.1205805.

Structure of the FANCI-FANCD2 complex: insights into the Fanconi anemia DNA repair pathway

Affiliations

Structure of the FANCI-FANCD2 complex: insights into the Fanconi anemia DNA repair pathway

Woo Joo et al. Science. .

Abstract

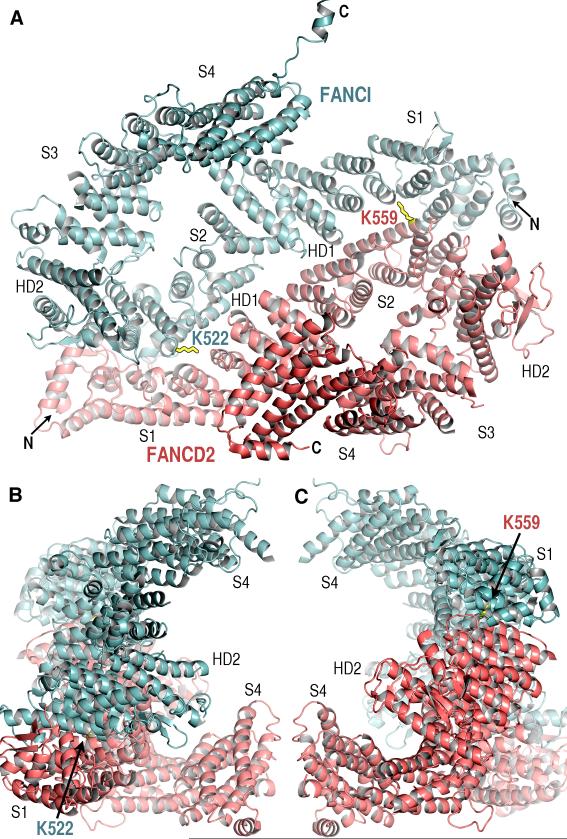
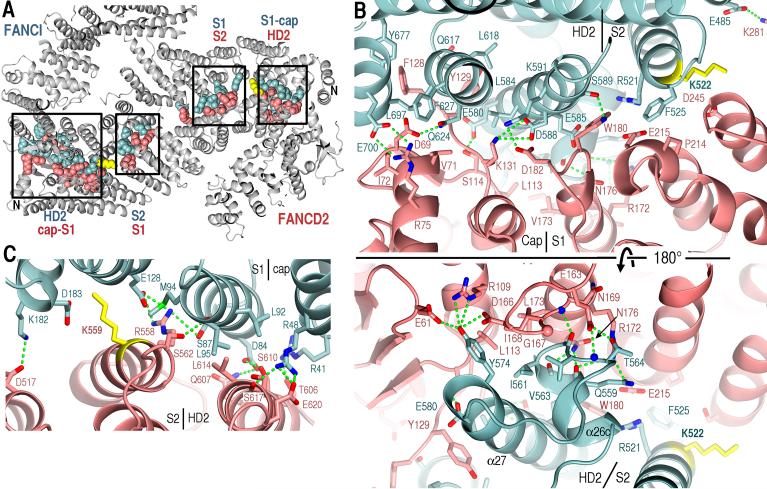
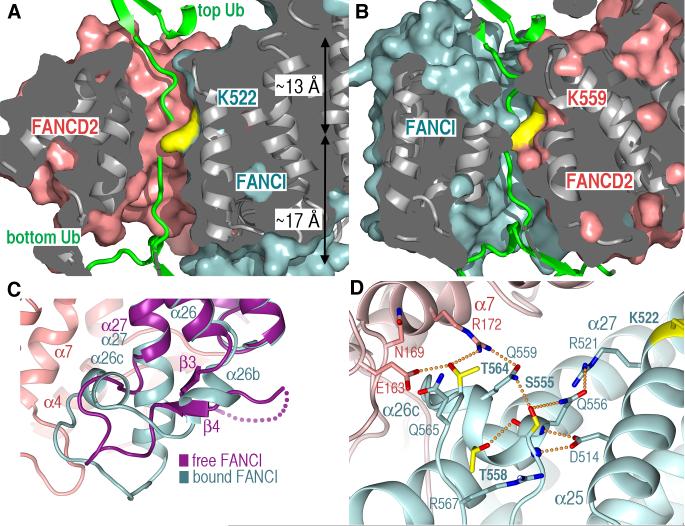
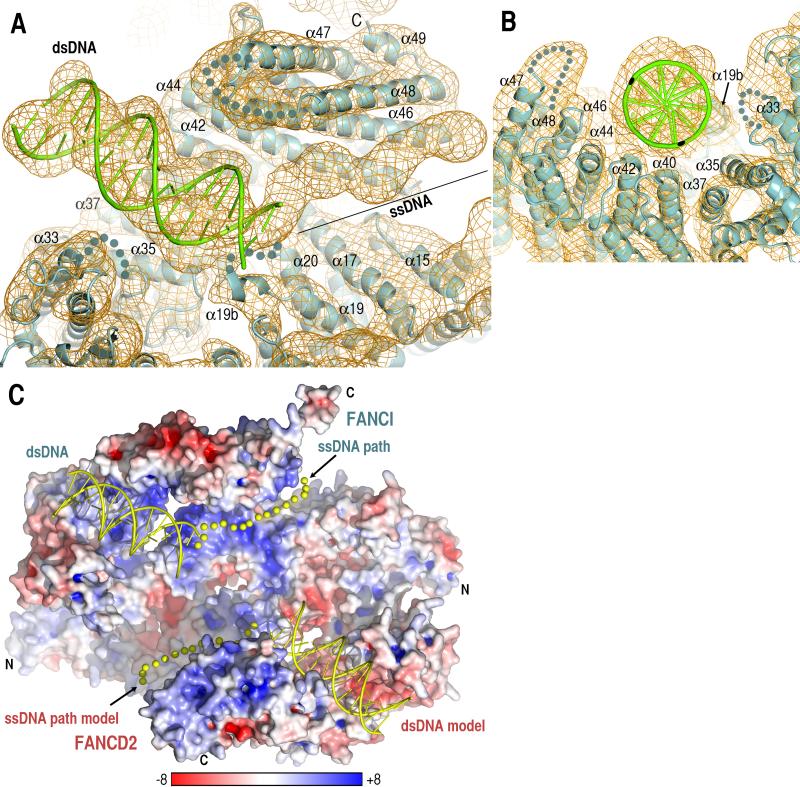
Fanconi anemia is a cancer predisposition syndrome caused by defects in the repair of DNA interstrand cross-links (ICLs). Central to this pathway is the Fanconi anemia I-Fanconi anemia D2 (FANCI-FANCD2) (ID) complex, which is activated by DNA damage-induced phosphorylation and monoubiquitination. The 3.4 angstrom crystal structure of the ~300 kilodalton ID complex reveals that monoubiquitination and regulatory phosphorylation sites map to the I-D interface, suggesting that they occur on monomeric proteins or an opened-up complex and that they may serve to stabilize I-D heterodimerization. The 7.8 angstrom electron-density map of FANCI-DNA crystals and in vitro data show that each protein has binding sites for both single- and double-stranded DNA, suggesting that the ID complex recognizes DNA structures that result from the encounter of replication forks with an ICL.


Figures

Fig. 1
Fig. 1. The overall structure of the ID complex
(A) View looking into the interior of the trough-like structure. The FANCI (cyan) and FANCD2 (pink) Solenoid (S1 to S4), HD1 and HD2 domains are labeled near to their center. The ubiquitination site lysine side chains are in black-outlined yellow. The FANCD2 K559 side chain is poorly ordered. (B) View orthogonal to (A) looking down the left end. Only the segments closest to the viewer are labeled. (C) View orthogonal to (A) looking down the right end.
Fig. 2
Fig. 2. The I-D interface
(A) Portion of the ID structure (gray) showing CPK representations of side chains within intermolecular-contact distance. Boxes indicate clusters of contacts with their respective segments labeled. (B) Close-up view of the FANCD2 Cap-Solenoid 1 and FANCI Solenoid 2-HD2 segments showing side chains from (A). Green dotted lines indicate hetero-atoms within hydrogen bonding distance and geometry. Top-panel orientation is similar to (A), with bottom panel rotated ~180° about the horizontal axis. The approximate boundaries of segments are labeled. (C) The reciprocal end of the interface formed by the FANCI Cap-Solenoid 1 and FANCD2 Solenoid 2-HD2 segments.
Fig. 3
Fig. 3. Mono-ubiquitination and phosphorylation sites of the ID complex
(A) Surface representation of the solvent-accessible tunnel harboring the FANCI K522 ubiquitination site, looking from the interface center. The surface portion above the figure plane is clipped, and the surface interior is gray. The approximate distances from the lysine to the tunnel exits are indicated. Free ubiquitin structure (green) was manually docked with its tail approaching from either the “top” or “bottom” exits of the tunnel. (B) Surface representation of the FANCD2 K559 tunnel. As in (A), two ubiquitin molecules were docked approaching from either tunnel exit. (C) The FANCI Ser555, Thr564 and Thr566 phosphorylation sites map to an HD2 segment that undergoes a conformational change between free FANCI (purple) and FANCD2-bound FANCI (cyan). In free-FANCI, the three sites map to a disordered loop (dotted purple line). FANCD2 is in pink. (D) The hydrogen bond network centered on the phosphorylation sites, also showing neighboring residues that may interact with the phosphorylated residues.
Fig. 4
Fig. 4. Electron density map of the Y DNA-FANCI crystals reveals bound double- and single-stranded DNA segments
(A) 7.8 Å resolution Focalc) map, contoured at 1.2 σ, calculated with molecular replacement phases that were improved by 3-fold ncs and multi-crystal averaging. The manually-positioned model of ideal B-type DNA is shown in cartoon representation (green), and the tubular density of ssDNA is marked by a black line. Orientation similar to Figure 1A. (B) View looking down the blunt-end of the Y DNA. (C) The electrostatic potential of the ID molecular surface showing the dsDNA cartoon and ssDNA path (yellow spheres) from the Y DNA-FANCI maps, as well as their models on FANCD2, positioned by superimposing Solenoids 3-4 of the two paralogs. The electrostatic potential was calculated with APBS (24) and illustrated (-8 to +8 kT) with Pymol (25).

References

    1. Moldovan GL, D'Andrea AD. Annu Rev Genet. 2009;43:223. - PMC - PubMed
    1. Wang W. Nat Rev Genet. 2007 Oct;8:735. - PubMed
    1. Kee Y, D'Andrea AD. Genes Dev. 2010 Aug 15;24:1680. - PMC - PubMed
    1. Raschle M, et al. Cell. 2008 Sep 19;134:969. - PMC - PubMed
    1. Knipscheer P, et al. Science. 2009 Dec 18;326:1698. - PMC - PubMed

Publication types

MeSH terms