. 2011 Jul;23(7):2631-43.
doi: 10.1105/tpc.111.086884. Epub 2011 Jul 15.

In vitro reconstitution of the cyanobacterial photoprotective mechanism mediated by the Orange Carotenoid Protein in Synechocystis PCC 6803

Affiliations

In vitro reconstitution of the cyanobacterial photoprotective mechanism mediated by the Orange Carotenoid Protein in Synechocystis PCC 6803

Michal Gwizdala et al. Plant Cell. 2011 Jul.

Abstract

In conditions of fluctuating light, cyanobacteria thermally dissipate excess absorbed energy at the level of the phycobilisome, the light-collecting antenna. The photoactive Orange Carotenoid Protein (OCP) and Fluorescence Recovery Protein (FRP) have essential roles in this mechanism. Absorption of blue-green light converts the stable orange (inactive) OCP form found in darkness into a metastable red (active) form. Using an in vitro reconstituted system, we studied the interactions between OCP, FRP, and phycobilisomes and demonstrated that they are the only elements required for the photoprotective mechanism. In the process, we developed protocols to overcome the effect of high phosphate concentrations, which are needed to maintain the integrity of phycobilisomes, on the photoactivation of the OCP, and on protein interactions. Our experiments demonstrated that, whereas the dark-orange OCP does not bind to phycobilisomes, the binding of only one red photoactivated OCP to the core of the phycobilisome is sufficient to quench all its fluorescence. This binding, which is light independent, stabilizes the red form of OCP. Addition of FRP accelerated fluorescence recovery in darkness by interacting with the red OCP and destabilizing its binding to the phycobilisome. The presence of phycobilisome rods renders the OCP binding stronger and allows the isolation of quenched OCP-phycobilisome complexes. Using the in vitro system we developed, it will now be possible to elucidate the quenching process and the chemical nature of the quencher.


Figures

Figure 1.
Figure 1.
Effect of Phosphate Concentration on OCPo-to-OCPr Conversion. (A) Decrease of maximal fluorescence induced by illumination with strong blue-green light (1285 μmol photons m−2 s−1, 400 to 550 nm) in Synechocystis cells in 0.08 M (open squares), 0.4 M (open triangles), 0.6 M (closed triangles), and 0.8 M (closed circles) phosphate buffer. The measurements were done with a PAM fluorometer. Data show means (± sd) of four independent experiments. (B) Increase of absorbance at 550 nm during illumination of isolated OCP (OD 0.35 at 496 nm) at 23°C in 0.8 M (closed circles), 0.7 M (closed squares), 0.6 M (closed triangles), 0.5 M (open circles), 0.4 M (open triangles), and 0.08 M (open squares) phosphate buffer. The OCP was illuminated with white light (5000 μmol photons m−2 s−1).
Figure 2.
Figure 2.
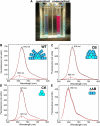
Fluorescence Quenching Induced by Illumination of PBs in the Presence of OCP. (A) Photograph of the quenched (left) and unquenched (right) PBs illuminated by white light showing the fluorescence emitted by the samples. The color of the unquenched PBs is a result of the red fluorescence of PC and APC. (B) to (E) The room temperature fluorescence spectra of dark unquenched (solid black line), light unquenched (dashed red line), and light quenched PBs (solid red line) isolated from wild-type (B), CB (C), CK (D), and ΔAB (E) Synechocystis strains. The PBs (0.013 μM) were illuminated 5 min with white light (5000 μmol photons m−2 s−1) in the absence (light unquenched) or in the presence of OCP (0.53 μM) (light quenched). rel units, relative units.
Figure 3.
Figure 3.
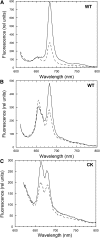
77 K Fluorescence Spectra of PBs. (A) to (C) Spectra represent unquenched (solid lines) and quenched (dashed lines) PBs. To partially dissociated WT-PB, they were incubated 2 h in 0.4 M phosphate buffer. To dissociate the PB cores, the CK-PBs were incubated 5 min in 0.08 M phosphate buffer and then resuspended in 0.8 M phosphate. The PBs (0.013 μM) were illuminated 3 min with white light (5000 μmol photons m−2 s−1) in the presence of OCP (0.53 μM). rel units, relative units. (A) Spectra using whole WT-PBs. (B) Spectra using partially dissociated WT-PBs. (C) Spectra using partially dissociated CK-PBs.
Figure 4.
Figure 4.
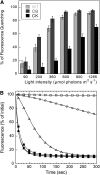
Effect of OCP Concentration on PB Fluorescence Quenching. The PBs (0.013 μM) were illuminated with blue-green light (400 to 550 nm, 870 μmol photons m−2 s−1) in the absence or in the presence of different concentrations of OCP giving an OCP-to-PB ratio of 40, 20, 8, and 4. (A) The percentage of fluorescence quenching after 5 min of illumination for the wild type (light gray), CB (dark gray), and CK (black). Data shows the means (± sd) of experiments done with three independent preparations of each type of PB and two independent preparations of OCP. In each experiment, the measurements were done twice. (B) Kinetics of fluorescence decrease in WT-PBs (closed symbols) and CK-PBs (open symbols) illuminated in the presence of different OCP concentrations given an OCP-to-PB ratio of 40 (circles), 8 (triangles), and 0 (closed squares). The fluorescence measurements were performed with a PAM fluorometer.
Figure 5.
Figure 5.
Effect of Light Intensity on PB Fluorescence Quenching. (A) The PBs (0.013 μM) were illuminated in the presence of an excess of OCP (0.53 μM; 40 OCP per PB) with blue-green light at different light intensities. The decrease of fluorescence was followed by measuring in a PAM fluorometer. The percentage of fluorescence quenching after 5 min illumination is presented in the figure for the wild type (light gray), CB (dark gray), and CK (black). Data shows the means (±sd) of experiments done with three independent preparations of each type of PB and two independent preparations of OCP. In each experiment, the measurements were done twice (B) The traces of fluorescence decrease are shown. The PBs were illuminated in the presence of OCP in darkness (open squares) or at 90 (open circles) or 1285 (open triangles) μmol photons m−2 s−1 of blue-green light in 0.8 M phosphate, or the OCP was first illuminated (5000 μmol photons m−2 s−1, white light) in 0.08 M phosphate buffer and completely converted to OCPr and then the PBs were added and illuminated at 90 (closed circles) or 1285 (closed triangles) μmol photons m−2 s−1 of blue-green light or they remained in darkness (closed squares) in 0.8 M phosphate.
Figure 6.
Figure 6.
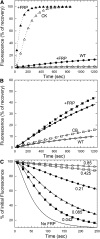
Effect of FRP Presence in Darkness and during Illumination. (A) and (B) WT-, CB-, and CK PBs (0.013 μM) in 0.8 M (A) and 0.5 M phosphate buffer (B) were illuminated in the presence of OCP (0.53 μM) during 5 min with 870 photons m−2 s−1 blue-green light, and then, in darkness, the recovery of fluorescence was followed using a PAM fluorometer in the absence or in the presence of FRP (16 μM). FRP was added just after light was turned off. The kinetics of fluorescence recovery in 0.8 M phosphate using WT- and CB-PBs were identical. Only wild type results are shown. (C) WT-PBs (0.013 μM) were illuminated in the presence of OCP (0.53 μM) and different concentrations of FRP: 0.85 μM (open circles), 0.425 μM (open squares), 0.21 μM (closed circles), 0.085 μM (closed triangles), and 0.0425 μM (closed squares) or in the absence of FRP (solid line, no symbols). The FRP-to-OCP ratio goes from 1.6 to 0.08.
Figure 7.
Figure 7.
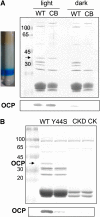
Protein Composition of the OCP-PB Complex. (A) Isolation of OCP-PB complexes using Suc gradient centrifugation (left) and polypeptide composition of the blue band containing purified OCP-WT-PB and OCP-CB-PB complexes (top right) and OCP detection by immunoblot (bottom right). PBs were incubated in the presence of excess OCP in darkness or under strong illumination and then loaded in a Suc gradient and reisolated. (B) Polypeptide composition of the blue band obtained after illumination of WT-PBs in the presence of WT-OCP (WT) or Y44S-OCP (Y44S) and of CK-PBs illuminated with WT-OCP loaded in the gradient Suc just after illumination (CK) or after fluorescence recovery (CKD). OCP detection by protein gel blot is also shown. In (A) and (B), in each lane was contained 10 μL of a solution containing 0.5 μM PBs. The OCP is shown by an arrow.
Figure 8.
Figure 8.
Room Temperature Fluorescence Spectra and Polypeptide Composition of OCP-PB Complexes. (A) Fluorescence spectra of WT-PBs that were incubated in darkness (solid line) or under strong illumination (dashed line, L) with OCP and then reisolated in a Suc gradient. The isolated OCP-PB complexes were incubated 30 min in darkness, in 0.5 M phosphate, in the absence (dashed-dotted line, D) or in the presence of FRP (dotted line, D+F) and then reisolated in a Suc gradient to detect the presence of OCP in the partially quenched complexes. rel units, relative units. (B) Polypeptide composition of the OCP-PB complexes obtained after illumination (L) and of the obtained complexes after incubation in darkness in the presence of FRP (D+F) or in its absence (D). The OCP detection by immunoblotting is also shown. Each lane contained 10 μL of a solution containing 0.5 μM PBs.
Figure 9.
Figure 9.
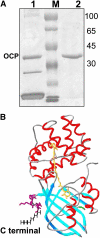
The OCP-PB Complex Does Not Attach to a Nickel Column. (A) Polypeptide composition of the fractions nonretained (1) and retained (2) by the nickel column. (B) OCP structure showing the position of the C-terminal His-tag. The His-tag is not seen in the published structure; the position is only indicative. [See online article for color version of this figure.]

References

    1. Adir N. (2005). Elucidation of the molecular structures of components of the phycobilisome: Reconstructing a giant. Photosynth. Res. 85: 15–32 - PubMed
    1. Ajlani G., Vernotte C., Dimagno L., Haselkorn R. (1995). Phycobilisome core mutants of Synechocystis PCC 6803. Biochim. Biophys. Acta 1231: 189–196
    1. Arteni A.A., Liu L.N., Aartsma T.J., Zhang Y.Z., Zhou B.C., Boekema E.J. (2008). Structure and organization of phycobilisomes on membranes of the red alga Porphyridium cruentum. Photosynth. Res. 95: 169–174 - PMC - PubMed
    1. Bailey S., Grossman A. (2008). Photoprotection in cyanobacteria: Regulation of light harvesting. Photochem. Photobiol. 84: 1410–1420 - PubMed
    1. Boulay C., Wilson A., D’Haene S., Kirilovsky D. (2010). Identification of a protein required for recovery of full antenna capacity in OCP-related photoprotective mechanism in cyanobacteria. Proc. Natl. Acad. Sci. USA 107: 11620–11625 - PMC - PubMed

LinkOut - more resources