. 2011 Jul;23(7):2619-30.
doi: 10.1105/tpc.111.086876. Epub 2011 Jul 15.

Control of hydrogen photoproduction by the proton gradient generated by cyclic electron flow in Chlamydomonas reinhardtii

Affiliations

Control of hydrogen photoproduction by the proton gradient generated by cyclic electron flow in Chlamydomonas reinhardtii

Dimitri Tolleter et al. Plant Cell. 2011 Jul.

Abstract

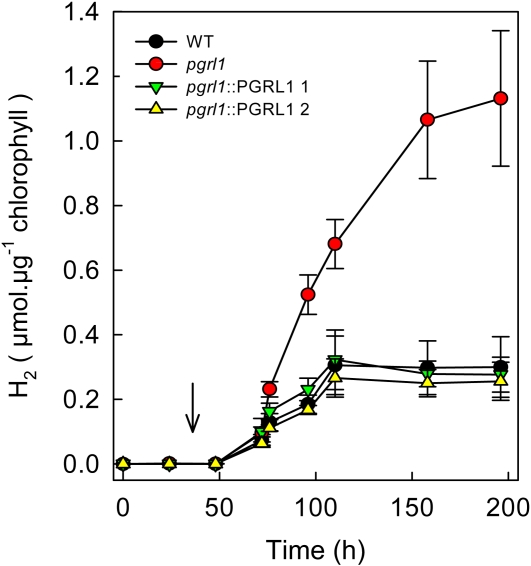
Hydrogen photoproduction by eukaryotic microalgae results from a connection between the photosynthetic electron transport chain and a plastidial hydrogenase. Algal H₂ production is a transitory phenomenon under most natural conditions, often viewed as a safety valve protecting the photosynthetic electron transport chain from overreduction. From the colony screening of an insertion mutant library of the unicellular green alga Chlamydomonas reinhardtii based on the analysis of dark-light chlorophyll fluorescence transients, we isolated a mutant impaired in cyclic electron flow around photosystem I (CEF) due to a defect in the Proton Gradient Regulation Like1 (PGRL1) protein. Under aerobiosis, nonphotochemical quenching of fluorescence (NPQ) is strongly decreased in pgrl1. Under anaerobiosis, H₂ photoproduction is strongly enhanced in the pgrl1 mutant, both during short-term and long-term measurements (in conditions of sulfur deprivation). Based on the light dependence of NPQ and hydrogen production, as well as on the enhanced hydrogen production observed in the wild-type strain in the presence of the uncoupling agent carbonyl cyanide p-trifluoromethoxyphenylhydrazone, we conclude that the proton gradient generated by CEF provokes a strong inhibition of electron supply to the hydrogenase in the wild-type strain, which is released in the pgrl1 mutant. Regulation of the trans-thylakoidal proton gradient by monitoring pgrl1 expression opens new perspectives toward reprogramming the cellular metabolism of microalgae for enhanced H₂ production.


Figures

Figure 1.
Figure 1.
Isolation of the pgrl1 Mutant from the Screening of a Chlamydomonas Insertion Mutant Library Based on the Analysis of Chlorophyll Fluorescence Transients. (A) View of the experimental design used for colony screening of a Chlamydomonas insertion mutant library. (B) Chlorophyll fluorescence transient recorded on a single colony during a dark–light–dark transient in wild-type cells and in a mutant (pgrl1) showing a modified fluorescence transient. The black and white boxes at the bottom indicate dark and light periods, respectively. r.u., relative units. (C) Location of the insertion site of the APHVIII cassette conferring paromomycin resistance in chromosome 7, at the level of the first exon of the PGRL1 gene. (D) RT-PCR showing expression of PGRL1 and TUBULIN1 (TUB1) genes in the wild type (WT) and the pgrl1 mutant. (E) Immunoblot analysis of PGRL1 levels in the wild type and the pgrl1 mutant (top panel) and loading control using Coomassie blue staining (bottom panel). (F) and (G) Time course of ETR (F) and NPQ (G) determined from chlorophyll fluorescence measurements shown in Supplemental Figure 1 online during a dark–light transient. Actinic light (75 μmol photons·m−2·s−1) was switched on at T0 on 30 min dark-adapted pgrl1 and wild-type cells. Data are expressed as average values ± sd (bars) of four independent experiments. Wild-type cells (black dots); pgrl1 mutant cells (red dots).
Figure 2.
Figure 2.
Complementation of the pgrl1 Mutant and Light Dependence of ETR and NPQ. Analysis of chlorophyll fluorescence properties and expression of PGRL1 transcript and protein in wild-type cells, in the pgrl1 mutant, and in the two complemented lines pgrl1::PGRL1 1 and pgrl1::PGRL1 2. (A) Chlorophyll fluorescence transient recorded on a single colony during a dark–light–dark transient in C. reinhardtii wild-type, in the pgrl1 mutant, and in the two complemented strains pgrl1::PGRL1 1 and pgrl1::PGRL1 2. r.u., relative units. (B) RT-PCR showing expression of PGRL1 and TUB1 genes. WT, wild type. (C) Immunoblot analysis of PGRL1 (top panel) and loading control using Coomassie blue staining (bottom panel). (D) and (E) ETR (D) and NPQ (E) determined from chlorophyll fluorescence measurements performed on light-adapted cells after 40 s of illumination at each given fluence. Data are expressed as average values ± sd (bars) of four independent experiments.
Figure 3.
Figure 3.
LHCSR3 Amounts and NPQ in Low Light and High Light Acclimated Cells. Wild-type (WT) and pgrl1 cells were adapted for 16 h in low light (LL; 20 μmol photons·m−2·s−1) or high light (HL; 200 μmol photons·m−2·s−1) in TAP medium and then shifted to HSM medium in LL or HL (LL-LL, LL-HL, and HL-HL culture) at an equal chlorophyll concentration (3.5 μg∙mL−1). (A) After 2 h, whole-cell extracts (2.5 μg chlorophyll) were fractionated on a 13% SDS-PAGE gel, and LHCSR3 levels were quantified by immunoblotting using CF1 (ATPase subunit) as loading control. (B) and (C) Samples from the experiment described above were dark-adapted for 20 min, and NPQ was recorded during 5.2 min of illumination at 800 μmol photons m−2·s−1 (white bar) followed by 4.3 min of darkness (black bar). Plotted values are the means of three measurements ± sd.
Figure 4.
Figure 4.
Short-Term Hydrogen Photoproduction under Anaerobiosis. Hydrogen production was measured using a membrane inlet mass spectrometer. After induction of hydrogenase for 45 min in the dark under anaerobic conditions obtained by addition of glucose and glucose oxidase to the reaction medium, light was switched on (dashed line) either at 50 μmol photons·m−2·s−1 PAR ([A] and [B]) or at 200 μmol photons·m−2·s−1 ([C] and [D]). Hydrogen evolution was measured in the wild type (black line), in pgrl1 (red line), and in the two complemented lines pgrl1::PGRL1 1 (green line) and pgrl1::PGRL1 2 (yellow line). (A) and (C) Control experiments. (B) and (D) Effect of the uncoupling agent FCCP added at a final concentration of 2 μM 3 min before the start of the experiment.
Figure 5.
Figure 5.
Long-Term Hydrogen Production Measured in Response to Sulfur Deficiency. Exponentially growing cells (TAP medium) were centrifuged and resuspended in a sulfur-free medium (initial cellular concentration was 4 × 10⁶ cells·mL−1) in illuminated (200 μmol photons·m−2·s−1) sealed flasks. When indicated by an arrow, the cell suspension was bubbled with N2 to remove residual O2 and synchronize hydrogen production. Data are expressed as the average values ± sd of three independent experiments. WT, wild type.
Figure 6.
Figure 6.
Intracellular Starch Contents Measured during Long-Term Hydrogen Photoproduction under Conditions of Sulfur Deprivation. Wild-type (closed circle); pgrl1 (open circle). Data are expressed as the average value ± sd (bars) of three independent experiments. Starch accumulated during the first 24 h of sulfur deprivation and was then progressively degraded. (A) Control in the absence of DMCU (similar experiment as in Figure 5). (B) In the presence of DCMU (20 μM final concentration) added at t = 24 h (similar experiment as in Supplemental Figure 4 online).
Figure 7.
Figure 7.
Immunoblot Analysis of Key Proteins during Sulfur Deprivation in the Wild Type, in a pgrl1 Knockdown Line (pgrl1-kd), and in the pgrl1 Knockout Mutant (pgrl1-ko) during Sulfur Deprivation. Extracts were prepared from two independent sulfur deprivation experiments and fractionated on 13% SDS-PAGE, and the abundance of CF1, HYDA, PSBA, PGRL1, LHCSR3, LHCBM6, LHCA3, PSAD, and COX2B was analyzed by immunoblotting. CF1 (ATPase) signal served as a loading control. (A) Whole-cell extracts of the wild type (WT) and pgrl1-ko (i-e pgrl1). All immunoblots originate from SDS-PAGE gels loaded with 2.5 μg chlorophyll per lane. (B) Whole-cell extracts of the wild type and pgrl1-kd. All immunoblots originate from SDS-PAGE gels loaded with 40 μg protein per lane, with the exception of the HYDA immunoblot, whose gel was loaded with 3 μg chlorophyll per lane.

Similar articles

Cited by

References

    1. Alric J., Lavergne J., Rappaport F. (2010). Redox and ATP control of photosynthetic cyclic electron flow in Chlamydomonas reinhardtii (I) aerobic conditions. Biochim. Biophys. Acta 1797: 44–51 - PubMed
    1. Antal T.K., Krendeleva T.E., Laurinavichene T.V., Makarova V.V., Ghirardi M.L., Rubin A.B., Tsygankov A.A., Seibert M. (2003). The dependence of algal H2 production on Photosystem II and O2 consumption activities in sulfur-deprived Chlamydomonas reinhardtii cells. Biochim. Biophys. Acta 1607: 153–160 - PubMed
    1. Antal T.K., Volgusheva A.A., Kukarskih G.P., Krendeleva T.E., Rubin A.B. (2009). Relationships between H2 photoproduction and different electron transport pathways in sulfur-deprived Chlamydomonas reinhardtii. Int. J. Hydrogen Energy 34: 9087–9094
    1. Berthold P., Schmitt R., Mages W. (2002). An engineered Streptomyces hygroscopicus aph 7″ gene mediates dominant resistance against hygromycin B in Chlamydomonas reinhardtii. Protist 153: 401–412 - PubMed
    1. Chochois V., Constans L., Dauvillée D., Beyly A., Solivérès M., Ball S., Peltier G., Cournac L. (2010). Relationships between PSII-independent hydrogen bioproduction and starch metabolism as evidenced from isolation of starch catabolism mutants in the green alga Chlamydomonas reinhardtii. Int. J. Hydrogen Energy 35: 10731–10740

Publication types

MeSH terms