

Evaluation and comparison of food records, recalls, and frequencies for energy and protein assessment by using recovery biomarkers
- PMID: 21765003
- PMCID: PMC3202154
- DOI: 10.1093/aje/kwr140
Evaluation and comparison of food records, recalls, and frequencies for energy and protein assessment by using recovery biomarkers
Abstract
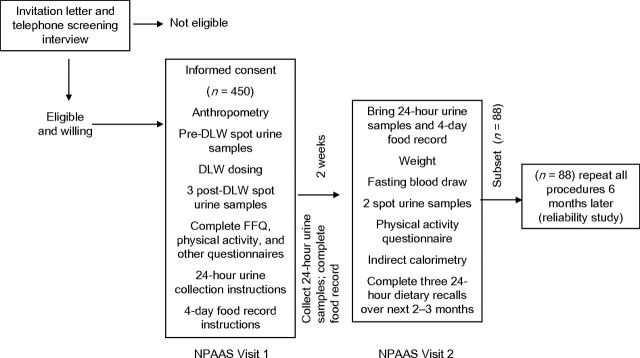
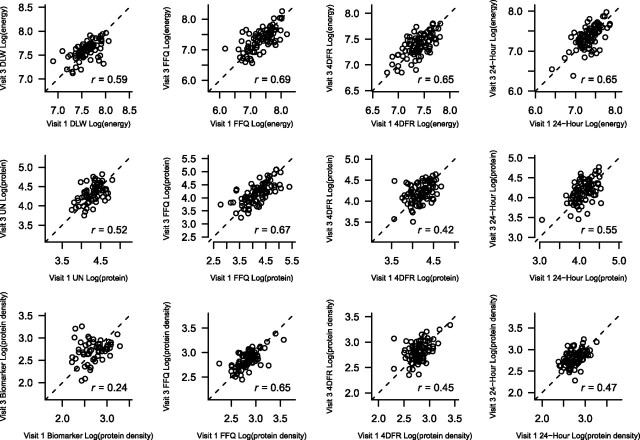
The food frequency questionnaire approach to dietary assessment is ubiquitous in nutritional epidemiology research. Food records and recalls provide approaches that may also be adaptable for use in large epidemiologic cohorts, if warranted by better measurement properties. The authors collected (2007-2009) a 4-day food record, three 24-hour dietary recalls, and a food frequency questionnaire from 450 postmenopausal women in the Women's Health Initiative prospective cohort study (enrollment, 1994-1998), along with biomarkers of energy and protein consumption. Through comparison with biomarkers, the food record is shown to provide a stronger estimate of energy and protein than does the food frequency questionnaire, with 24-hour recalls mostly intermediate. Differences were smaller and nonsignificant for protein density. Food frequencies, records, and recalls were, respectively, able to "explain" 3.8%, 7.8%, and 2.8% of biomarker variation for energy; 8.4%, 22.6%, and 16.2% of biomarker variation for protein; and 6.5%, 11.0%, and 7.0% of biomarker variation for protein density. However, calibration equations that include body mass index, age, and ethnicity substantially improve these numbers to 41.7%, 44.7%, and 42.1% for energy; 20.3%, 32.7%, and 28.4% for protein; and 8.7%, 14.4%, and 10.4% for protein density. Calibration equations using any of the assessment procedures may yield suitable consumption estimates for epidemiologic study purposes.
Trial registration: ClinicalTrials.gov NCT00000611.
Figures
References
-
- Diet, Nutrition, and the Prevention of Chronic Diseases: Report of a Joint WHO/FAO Expert Consultation. Geneva, Switzerland: World Health Organization; 2003. p. 88. (WHO technical report 916)
-
- World Cancer Research Fund/American Institute for Cancer Research. Food, Nutrition, and the Prevention of Cancer: A Global Perspective. Washington, DC: American Institute for Cancer Research; 1997. p. 371. - PubMed
-
- Bingham SA, Luben R, Welch A, et al. Are imprecise methods obscuring a relation between fat and breast cancer? Lancet. 2003;362(9379):212–214. - PubMed
-
- Freedman LS, Potischman N, Kipnis V, et al. A comparison of two dietary instruments for evaluating the fat-breast cancer relationship. Int J Epidemiol. 2006;35(4):1011–1021. - PubMed
