. 2011 Aug 15;187(4):1722-32.
doi: 10.4049/jimmunol.1100560. Epub 2011 Jul 15.

Cytomegalovirus-specific T cell immunity is maintained in immunosenescent rhesus macaques

Affiliations

Cytomegalovirus-specific T cell immunity is maintained in immunosenescent rhesus macaques

Luka Cicin-Sain et al. J Immunol. .

Abstract

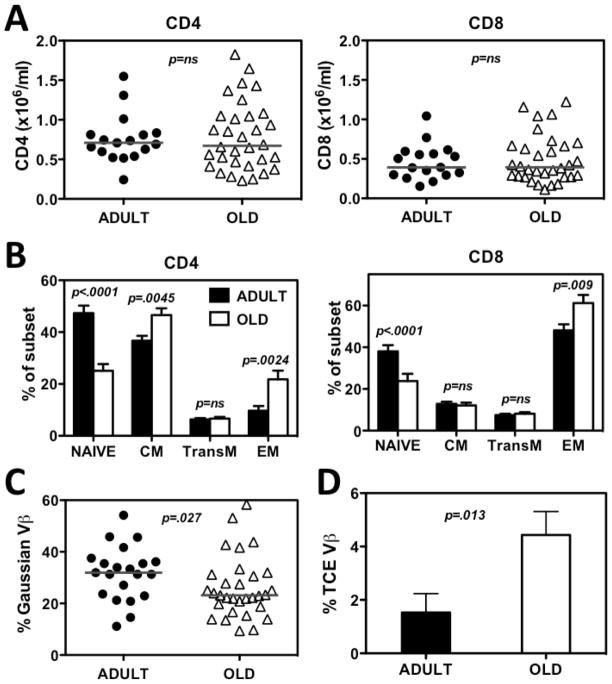
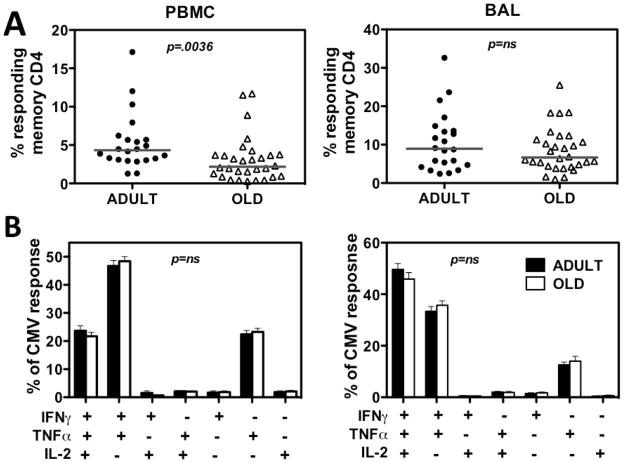
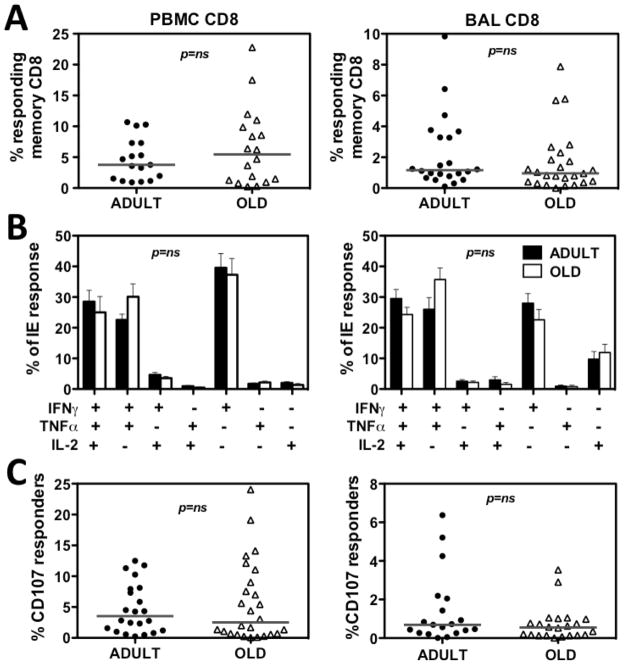
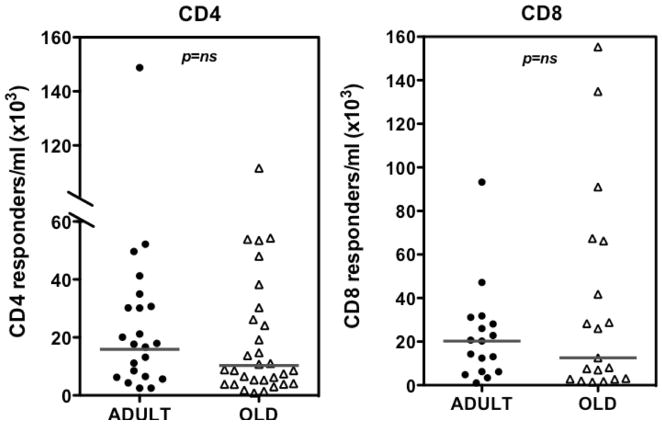
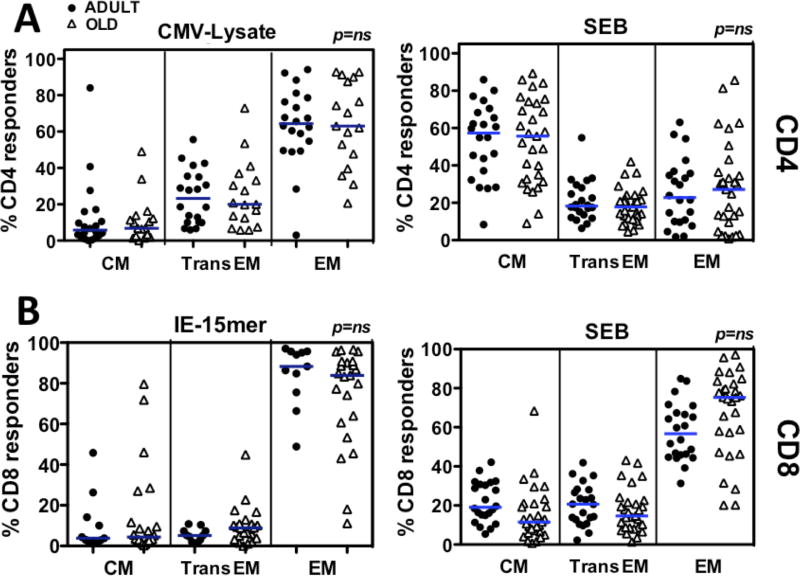
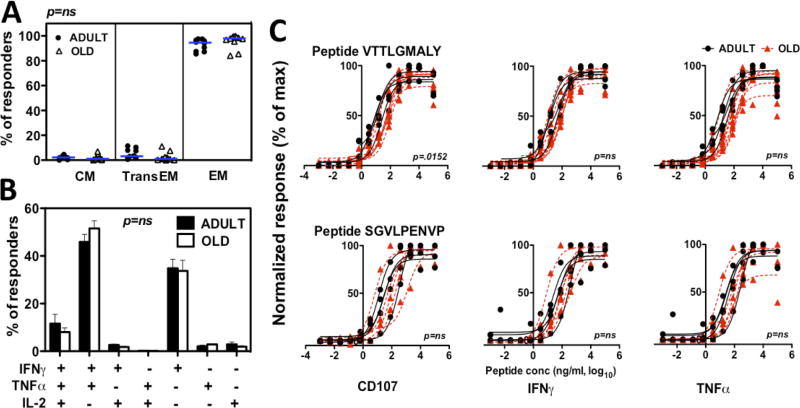
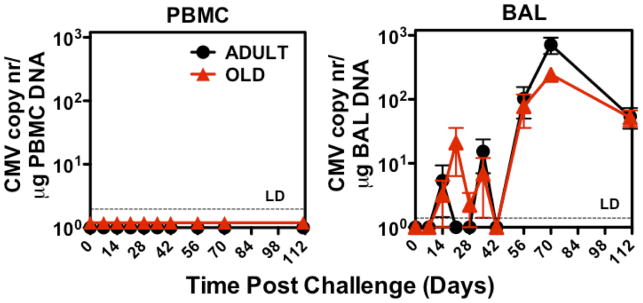
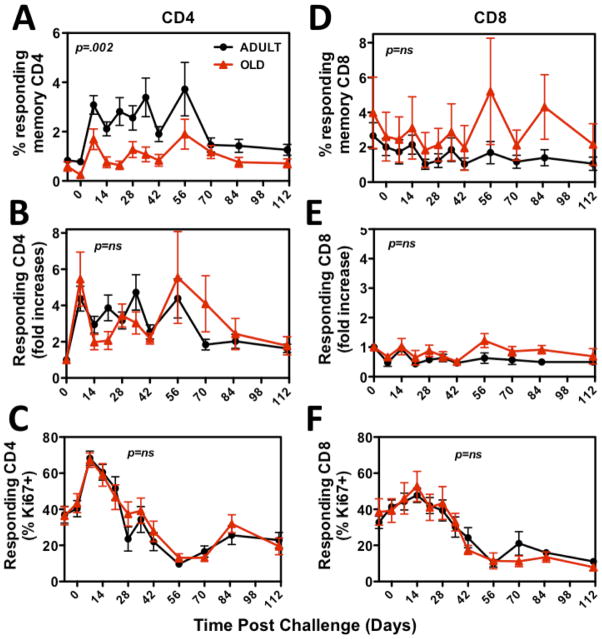
Although CMV infection is largely benign in immunocompetent people, the specific T cell responses associated with control of this persistent virus are enormous and must be maintained for life. These responses may increase with advanced age and have been linked to an "immune risk profile" that is associated with poor immune responsiveness and increased mortality in aged individuals. Based on this association, it has been suggested that CMV-specific T cell responses might become dysfunctional with age and thereby contribute to the development of immune senescence by homeostatic disruption of other T cell populations, diminished control of CMV replication, and/or excess chronic inflammation. In this study, we use the rhesus macaque (RM) model of aging to ask whether the quantity and quality of CMV-specific T cell responses differ between healthy adult RMs and elderly RMs that manifest hallmarks of immune aging. We demonstrate that the size of the CD4(+) and CD8(+) CMV-specific T cell pools are similar in adult versus old RMs and show essentially identical phenotypic and functional characteristics, including a dominant effector memory phenotype, identical patterns of IFN-γ, TNF-α, and IL-2 production and cytotoxic degranulation, and comparable functional avidities of optimal epitope-specific CD8(+) T cells. Most importantly, the response to and protection against an in vivo CMV challenge were identical in adult and aged RMs. These data indicate that CMV-specific T cell immunity is well maintained in old RMs and argue against a primary role for progressive dysfunction of these responses in the development of immune senescence.


Figures

Figure 1
Figure 1. Comparison of CD4 and CD8 T cell subset distribution and TCRB-defined clonality in adult vs. old RM
(A) Absolute lymphocyte counts were multiplied by the fraction of CD3+/CD4+ and CD3+/CD8+ small lymphocytes determined by flow cytometry to determine absolute CD4+ and CD8+ T cell counts in blood. Symbols show values obtained in individual adult or old monkeys, horizontal bars denote medians. P value was obtained by a two-tailed Mann-Whitney test. (B) PBMC were further analyzed for CD28, CCR7, and CD95 expression to determine frequencies of naïve, CM, TransEM, and EM subsets within the overall CD4+ and CD8+ T cell populations (see text). Histograms show mean frequencies of the indicated subsets in the adult and old RM cohorts, error bars show SEM. Indicated p values were obtained by mixed model ANOVA followed by step-down correction. (C) PBMC RNA was PCR analyzed with 24 primers specific for each TCRVB family followed by PAGE and densitometry to identify Vβ families showing a Gaussian distribution of PCR product densities over their length. Symbols indicate frequencies of TCRVB chains with Gaussian PCR products in individual monkeys over three years. Horizontal lines are medians; p value was obtained by a two-tailed Mann-Whitney test. (D) The same analysis as in C was performed to identify TCRVB families carrying a single PCR band over at least 2 consecutive years. Average frequencies of their occurrence in the adult and old monkey cohort are indicated. Error bars show SEM; p value was obtained by a two-tailed Mann-Whitney test.
Figure 2
Figure 2. Comparison of RhCMV-specific CD4+ T cell responses in adult vs. old RM
(A) PBMC and BAL cells were assessed for CD4+ T cell responses to RhCMV Ag preparations with cytokine flow cytometry as described in the Methods. The frequency of CD4+ T cells expressing CD69 and any combination of IFN-γ, TNF-α and IL-2 expression after incubation with and without RhCMV Ag preparation was determined, with the difference between these frequencies reported as the RhCMV-specific CD4+ T cell response frequency. These values were then normalized to the memory population size in each RM. Symbols show individual monkeys, horizontal lines denote medians. P value was obtained by a two-tailed Mann-Whitney test. (B) To determine if the pattern of IFN-γ, TNF-α and IL-2 production by RhCMV Ag-stimulated CD4+ T cells differed in adult vs. old RM, the contribution of each possible combination of these cytokines to the overall response was determined by Boolean gating, and statistically analyzed by a mixed effects regression model analysis. Histograms indicate average frequencies of each of the indicated patterns in adult vs. old responder cells; error bars are SEM.
Figure 3
Figure 3. Comparison of RhCMV/IE-specific CD8+ T cell responses in adult vs. old RM
(A) PBMC and BAL cells were assessed for CD8+ T cell responses to mixes of consecutive, overlapping (11 amino acid overlap) 15-mer peptides comprising the RhCMV IE-1 and IE-2 proteins with cytokine flow cytometry as described in the Methods. The frequency of CD8+ T cells expressing CD69 and any combination of IFN-γ, TNF-α and IL-2 expression after incubation with and without RhCMV IE peptides was determined, with the difference between these frequencies reported as the RhCMV-specific CD8+ T cell response frequency. These values were then normalized to the memory population size in each RM. Symbols show individual monkeys, horizontal lines denote medians. P value was obtained by a two-tailed Mann-Whitney test. (B) To determine if the pattern of IFN-γ, TNF-α and IL-2 production by RhCMV/IE peptide-stimulated CD8+ T cells differed in adult vs. old RM, the contribution of each possible combination of these cytokines to the overall response was determined by Boolean gating, and statistically analyzed by a mixed effects regression model analysis. Histograms indicate average frequencies of each of the indicated patterns in adult vs. old responder cells; error bars are SEM. Significance was assessed by mixed-effects regression model analysis. (C) The frequency of CD8+ T cells manifesting externalization of cytotoxic granules in response to RhCMV/IE peptide vs. control stimulation in PBMC (left) and BAL (right) was determined by CD107a and CD107b staining. These values were then normalized to the memory population size in each RM. Symbols show individual monkeys, horizontal lines denote medians. P value was obtained by two-tailed Mann-Whitney test.
Figure 4
Figure 4. Comparison of absolute counts of RhCMV-specific CD4+ and CD8+ T cells in adult vs. old RM
PBMC cells were stimulated to elicit cytokine responses in CD4+ or CD8+ T cells as shown in Figs. 2 and 3, respectively. Blood lymphocytes were counted in parallel, and this value was multiplied by the fraction of CD4+ or CD8+ RhCMV-specific lymphocytes to define the absolute count of RhCMV-specific CD4+ and CD8+ T cells. Symbols show individual monkeys, horizontal lines denote medians. P value was obtained by a two-tailed Mann-Whitney test.
Figure 5
Figure 5. Comparison of the phenotypically-defined differentiation state of RhCMV-specific T cell responses in adult vs. old RM
PBMC were stimulated with SEB (200ng/ml), whole RhCMV Ag preparations, RhCMV(IE) peptide mixes or no Ag, as described in Figs. 2 and 3. Cells were analyzed for the expression of CD3, CD4, CD8, CD69, IFN-γ, TNF-α and IL-2, as described in Figs. 2 and 3, and in addition, the surface markers CD28 and CCR7, with the CD28 vs. CCR7 phenotype (CM, TransEM, and EM designations as in Fig. 1) determined for all responding cells (CD69+ plus any combination of the 3 cytokines). To provide sufficient events for accurate phenotypic analysis, the data set was restricted to RM with specific response frequencies of >0.4%. (A) Analysis of CD4+ T cells. (B) Analysis of CD8+ T cells. Horizontal lines show medians. Significance assessed by Kruskall-Wallis test, with Dunn’s post-analysis. Of note, parametric statistical analysis by ANOVA with Bonferroni post-analysis revealed an age-related difference between the CD8+ T cell populations responding to SEB, at a significance of p<0.05, but not CD8+ T cell populations to IE, or any of the responding CD4+ T cell populations.
Figure 6
Figure 6. Comparison of the phenotype, cytokine profile and avidity of CD8+ T cells responding to immunodominant peptides in adult vs. old RM
(A) CD8+ cells responding to the immunodominant 9-mer peptides shown in Table I were phenotyped by CD28 and CCR7 surface expression as in Fig. 5. Symbols show individual adult vs. old RM, horizontal lines are medians. Significance was assessed by Kruskall-Wallis test, with Dunns post-analysis. (B) Cytokine profiles of CD8+ T cells responding to immunodominant 9-mer peptides shown in Table I were determined as in Fig. 3. Histograms indicate average values for adult vs. old RM; error bars are SEM. Significance was assessed by mixed-effects regression model analysis. (C) PBMC were stimulated with serial dilutions of the VTTLGMALY (top panels) or SGVLPENVP (bottom panels) peptides. The % CD8+ T cells responding to these peptides with CD107 surface expression, or intracellular production of IFN-γ or TNF-α was determined as in Fig. 3, and was normalized to the maximum response for each RM. Dose-response curves were defined by regression analysis in each RM, and adult and old RM were compared by mixed model analysis.
Figure 7
Figure 7. Comparison of RhCMV kinetics in adult and old monkeys after infectious RhCMV challenge
Adult (n=11) or old (n=9) RM were challenged by subcutaneous injection of 107 plaque forming units of RhCMV. RhCMV genomes in PBMC or BAL cells were quantified by qPCR and standardized to genomic host DNA. Average ± SEM of RhCMV copy numbers (y-axis) at indicated post-challenge days (x-axis) are indicated. LD = limit of detection.
Figure 8
Figure 8. Comparison of the in vivo proliferation response of RhCMV-specific T cells in adult vs. old RM following infectious RhCMV challenge
The adult and old RM challenged as shown in Fig. 7 were followed over time for frequencies of RhCMV-specific T cells in the circulating memory compartment by cytokine flow cytometry. Responding cells were defined by IFN-γ and/or TNF-α expression in CD69+ cells. Panels A–C show CD4+ T cells responding to whole RhCMV Ag preparations. Panels D–F show CD8+ T cells responding to RhCMV(IE) peptide mixes. Response frequencies are shown both as average ± SEM frequencies (A, D) and as average ± SEM fold change from the pre-challenge baseline (average of day -7 and day 0 values; B, E). Responding cells were simultaneously analyzed for expression of the proliferation marker Ki-67 (41) with results presented as average ± SEM for %Ki-67+ of the RhCMV-specific T cells (C-F). Statistical analysis was by repeated measures ANOVA.

References

    1. Ginaldi L, Loreto MF, Corsi MP, Modesti M, De Martinis M. Immunosenescence and infectious diseases. Microbes Infect. 2001;3:851–857. - PubMed
    1. High KP. Infection as a cause of age-related morbidity and mortality. Ageing Res Rev. 2004;3:1–14. - PubMed
    1. Hakim FT, Gress RE. Immunosenescence: deficits in adaptive immunity in the elderly. Tissue Antigens. 2007;70:179–189. - PubMed
    1. Aspinall R, Del Giudice G, Effros RB, Grubeck-Loebenstein B, Sambhara S. Challenges for vaccination in the elderly. Immun Ageing. 2007;4:9. - PMC - PubMed
    1. Weiskopf D, Weinberger B, Grubeck-Loebenstein B. The aging of the immune system. Transpl Int. 2009;22:1041–1050. - PubMed

Publication types

MeSH terms