. 2011 Aug;121(8):3233-43.
doi: 10.1172/JCI43124. Epub 2011 Jul 18.

Rac1 GTPase in rodent kidneys is essential for salt-sensitive hypertension via a mineralocorticoid receptor-dependent pathway

Affiliations

Rac1 GTPase in rodent kidneys is essential for salt-sensitive hypertension via a mineralocorticoid receptor-dependent pathway

Shigeru Shibata et al. J Clin Invest. 2011 Aug.

Abstract

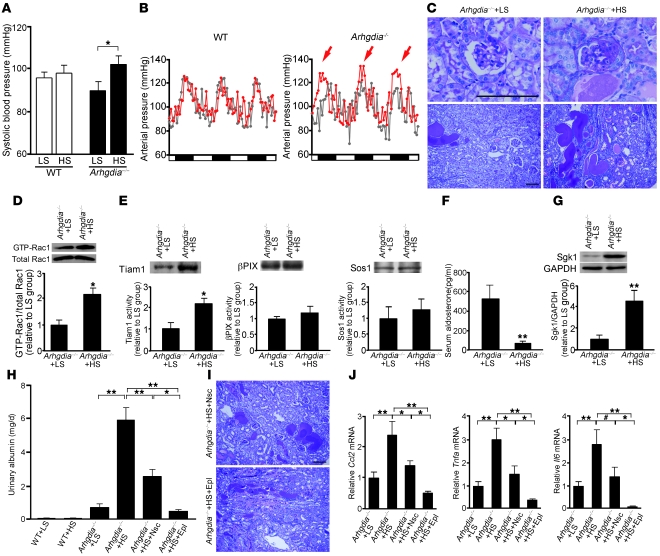
Hypertension is a leading contributor to cardiovascular mortality worldwide. Despite this, its underlying mechanism(s) and the role of excess salt in cardiorenal dysfunction are unclear. Previously, we have identified cross-talk between mineralocorticoid receptor (MR), a nuclear transcription factor regulated by the steroid aldosterone, and the small GTPase Rac1, which is implicated in proteinuric kidney disease. We here show that high-salt loading activates Rac1 in the kidneys in rodent models of salt-sensitive hypertension, leading to blood pressure elevation and renal injury via an MR-dependent pathway. We found that a high-salt diet caused renal Rac1 upregulation in salt-sensitive Dahl (Dahl-S) rats and downregulation in salt-insensitive Dahl (Dahl-R) rats. Despite a reduction of serum aldosterone levels, salt-loaded Dahl-S rats showed increased MR signaling in the kidneys, and Rac1 inhibition prevented hypertension and renal damage with MR repression. We further demonstrated in aldosterone-infused rats as well as adrenalectomized Dahl-S rats with aldosterone supplementation that salt-induced Rac1 and aldosterone acted interdependently to cause MR overactivity and hypertension. Finally, we confirmed the key role of Rac1 in modulating salt susceptibility in mice lacking Rho GDP-dissociation inhibitor α. Therefore, our data identify Rac1 as a determinant of salt sensitivity and provide insights into the mechanism of salt-induced hypertension and kidney injury.


Figures

Figure 1
Figure 1. Effects of high-salt loading on Rac1 activity and MR signaling activity in Dahl-R and Dahl-S rats.
(A) Systolic blood pressure, (B) urinary albumin excretion, and (C) serum aldosterone concentration in Dahl-R and Dahl-S rats fed a 0.3%- or 8%-salt diet for 3 weeks. (D) Expression of GTP-bound, active Rac1 and total Rac1 in the kidneys. The bar graph shows the results of densitometric analysis. (E) Expression of Sgk1 and GAPDH in the kidneys. The bar graph shows the results of densitometric analysis. (F) Nuclear expression of MR in the kidneys. Nucleophosmin (NPM) served as a loading control. The bar graph shows the results of densitometric analysis. (G) An immunofluorescence study for MR in salt-loaded Dahl-R and Dahl-S rats. Arrows indicate nuclear staining of MR in distal nephron. The MR staining was also noted in glomeruli (arrowheads). Scale bar: 50 μm. Data are expressed as mean ± SEM; n = 9 rats per group in AC; n = 4 or 5 rats per group in D; and n = 6 rats per group in E. *P < 0.05, **P < 0.01.
Figure 2
Figure 2. Inhibition of Rac1 ameliorates hypertension and renal damage in Dahl-S rats with the repression of MR signaling.
(A) Mean arterial pressure and (B) urinary albumin excretion were measured in salt-loaded Dahl-S rats treated with Nsc23766 (Nsc) or eplerenone (Epl). DSN, Dahl-S rats fed a 0.3%-salt diet. DSH, Dahl-S rats fed an 8%-salt diet. (C) Rac1 activity, (D) nuclear MR accumulation, and (E) Sgk1 expression in the kidneys. Bar graphs show the results of densitometric analysis. (F) Representative PAS-stained kidney sections. Scale bar: 50 μm. (G) Histological analysis of glomerulosclerosis by semiquantitative morphometric evaluation. (H) Representative micrographs of immunostaining for desmin in the glomeruli. Scale bar: 50 μm. (I) Semiquantitative analysis of immunostaining for desmin. Data are expressed as mean ± SEM; n = 5 each group. *P < 0.05, **P < 0.01.
Figure 3
Figure 3. Coadministration of salt and aldosterone causes blood pressure elevation with Rac1 and Sgk1 induction in the kidneys.
(A) Systolic blood pressure was measured at 2, 4, and 6 weeks in the indicated animals. Sham, sham-operated control rats that received a normal-salt (0.3%) diet. (B) Sgk1 expression in the kidneys. Samples from Sham kidneys are indicated in left 2 lanes, samples from Aldo+LS kidneys are indicated in middle 2 lanes, and samples from Aldo+HS kidneys are indicated in right 2 lanes. The bar graph shows the results of densitometric analysis. (C) GTP-bound active Rac1 expression in the kidneys. The bar graph shows the results of densitometric analysis. Data are expressed as mean ± SEM; n = 4 each group. **P < 0.01.
Figure 4
Figure 4. Rac1 inhibition prevents hypertension and glomerular injury in Aldo+HS rats.
(A) Effects of Nsc23766 treatment on systolic blood pressure in Aldo+HS rats at 6 weeks of treatment. (B) Effects of Nsc23766 on urinary albumin excretion in Aldo+HS rats at 6 weeks. (C) Suppression of GTP-bound Rac1 in the kidneys of Aldo+HS rats treated with Nsc23766. The bar graph shows the results of densitometric analysis. (D) Sgk1 expression in the kidneys of Aldo+HS rats treated with Nsc23766. The bar graph shows the results of densitometric analysis. (E) Quantitative real-time RT-PCR analysis of Nphs1 in the glomeruli. The expression levels were normalized to those of Actb and are expressed relative to those of Aldo+LS rats. (F) Representative immunofluorescence photomicrographs of nephrin in the glomeruli. Scale bar: 50 μm. (G) Representative micrographs of immunostaining for desmin. Scale bar: 50 μm. (H) Semiquantitative analysis of desmin staining. (I) Transmission electron micrographs of podocyte foot processes in the kidneys of indicated animals. Scale bar: 1 μm. Data are expressed as mean ± SEM; n = 4 each group for AE, and H. *P < 0.05, **P < 0.01, #0.05 < P < 0.1.
Figure 5
Figure 5. Effects of adrenalectomy and aldosterone supplementation in salt-loaded Dahl-S rats.
(A) Serum aldosterone, (B) systolic blood pressure, and (C) urinary albumin excretion were measured in salt-loaded Dahl-S rats that received adrenalectomy (DSH+ADx rats) or adrenalectomy followed by aldosterone supplementation (DSH+ADx+aldo rats). ND, not detected. (D) GTP-bound active Rac1 expression in the kidneys. Samples from DSH rats are indicated in left 2 lanes, samples from DSH+ADx rats are indicated in middle 2 lanes, and samples from DSH+ADx+aldo rats are indicated in right 2 lanes. The bar graph shows the results of densitometric analysis. (E) Nuclear MR accumulation in the kidneys. The bar graph shows the results of densitometric analysis. (F) Sgk1 expression in the kidneys. The bar graph shows the results of densitometric analysis. Data are expressed as mean ± SEM; n = 5 to 10 each group. *P < 0.05, **P < 0.01.
Figure 6
Figure 6. Blood pressure and renal injury in Arhgdia–/– mice are salt sensitive.
(A) Systolic blood pressure in wild-type and Arhgdia–/– mice that received a 0.05%-salt (LS) or 8%-salt (HS) diet for 4 weeks (n = 8, except n = 6 for Arhgdia–/– mice that received LS diet [Arhgdia–/–+LS mice]). (B) Hourly averages of 3-day recordings of mean arterial pressure by radiotelemetry before (gray) and after (red) salt loading. White and black boxes below the graphs represent subjective day and night, respectively. Mean arterial pressure was elevated by high salt in Arhgdia–/– mice (red arrows). (C) Representative PAS-stained kidney sections. Scale bar: 100 μm. (D) GTP-bound and total Rac1 in kidneys. The bar graph shows the results of densitometric analysis (n = 4). (E) Activity of Rac-GEFs evaluated by G15ARac1 pull-down assay (n = 4). Equal protein amounts of kidney homogenates were used as samples for each analysis. (F) Serum aldosterone concentration in Arhgdia–/–+LS mice (n = 6) and Arhgdia–/– mice that received HS diet (Arhgdia–/–+HS mice) (n = 8). (G) Sgk1 expression in the kidneys (n = 4). (H) Effects of Nsc23766 and eplerenone on albuminuria (wild-type mice that received LS diet [WT+LS mice], n = 5; wild-type mice that received HS diet [WT+HS mice], n = 4; Arhgdia–/–+LS mice, n = 7; Arhgdia–/–+HS mice, n = 8; Arhgdia–/–+HS mice that received Nsc23766, n = 8; Arhgdia–/–+HS mice that received eplerenone, n = 4). (I) Representative renal histology in the Nsc23766- or eplerenone-treated group. Scale bar: 100 μm. (J) Quantitative analysis of Ccl2, Tnfa, and Il6 mRNA expression. *P < 0.05, **P < 0.01, #0.05 < P < 0.1.
Figure 7
Figure 7. Effects of high-salt loading and aldosterone removal on Tiam1 activity in the Dahl model.
(A) Activity of Tiam1 in Dahl-R and Dahl-S rats fed a 0.3%- (NS) or 8%-salt diet, evaluated by G15ARac1 pull-down assay. Equal protein amounts of kidney homogenates were used as samples. (B) Effects of adrenalectomy (ADx) or adrenalectomy followed by aldosterone supplementation (ADx+aldo) on Tiam1 activity in salt-loaded Dahl-S rats. Data are expressed as mean ± SEM; n = 4 each group. *P < 0.05, **P < 0.01.
Figure 8
Figure 8. Involvement of Rac1 in the paradoxical response of MR to salt loading in salt-sensitive hypertension.
In the salt-resistant model, high-salt loading decreases Rac1 and MR activity. In contrast, high-salt loading causes Rac1 and MR activation in salt-sensitive hypertension. Salt and aldosterone interdependently regulate Rac1 (shown as blue lines), and Rac1 activity goes up in salt-sensitive subjects due to the pathological response of Rac1 to salt and aldosterone. Rac1 can exert a permissive effect on aldosterone-induced MR activation (shown in red).

References

    1. Kearney PM, Whelton M, Reynolds K, Muntner P, Whelton PK, He J. Global burden of hypertension: analysis of worldwide data. Lancet. 2005;365(9455):217–223. - PubMed
    1. Fujita T, Henry WL, Bartter FC, Lake CR, Delea CS. Factors influencing blood pressure in salt-sensitive patients with hypertension. Am J Med. 1980;69(3):334–344. doi: 10.1016/0002-9343(80)90002-9. - DOI - PubMed
    1. Intersalt: an international study of electrolyte excretion and blood pressure. Results for 24 hour urinary sodium and potassium excretion. Intersalt Cooperative Research Group. BMJ. 1988;297(6644):319–328. doi: 10.1136/bmj.297.6644.319. - DOI - PMC - PubMed
    1. Lifton RP, Gharavi AG, Geller DS. Molecular mechanisms of human hypertension. Cell. 2001;104(4):545–556. doi: 10.1016/S0092-8674(01)00241-0. - DOI - PubMed
    1. Guyton AC. Blood pressure control--special role of the kidneys and body fluids. Science. 1991;252(5014):1813–1816. doi: 10.1126/science.2063193. - DOI - PubMed

Publication types