. 2011 Aug;121(8):2993-3004.
doi: 10.1172/JCI57567. Epub 2011 Jul 18.

Matrix Gla protein deficiency causes arteriovenous malformations in mice

Affiliations

Matrix Gla protein deficiency causes arteriovenous malformations in mice

Yucheng Yao et al. J Clin Invest. 2011 Aug.

Abstract

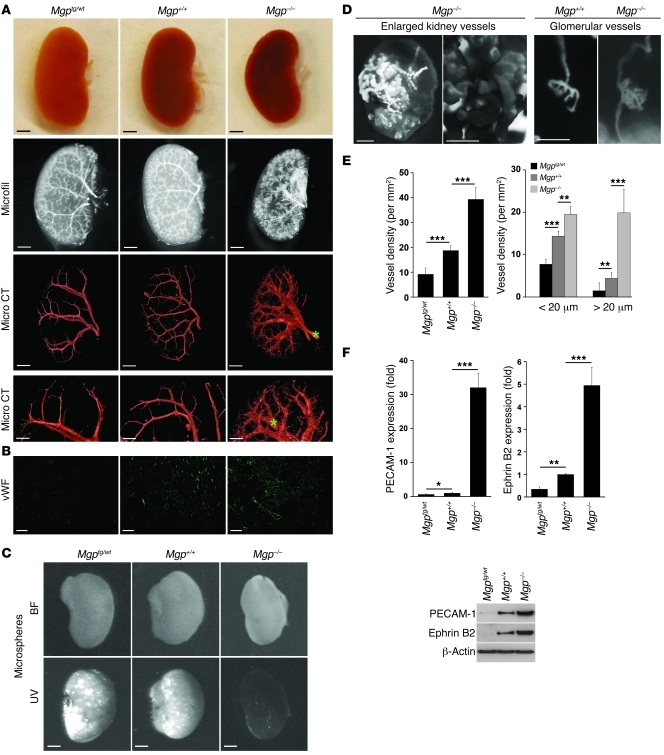
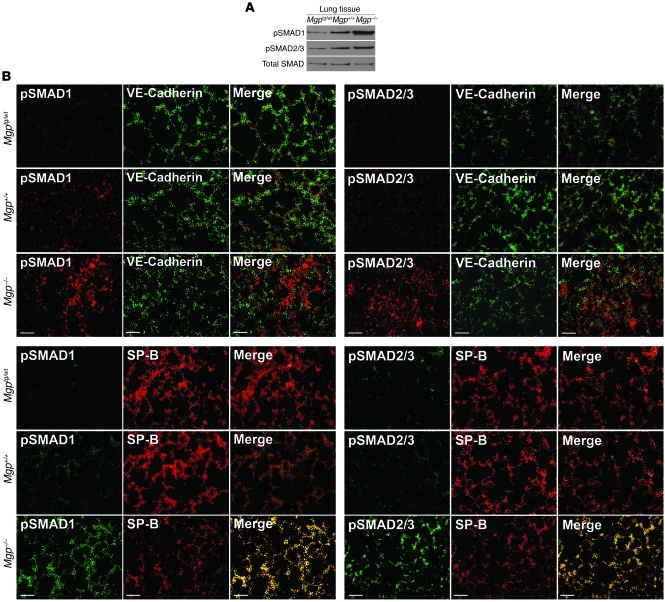
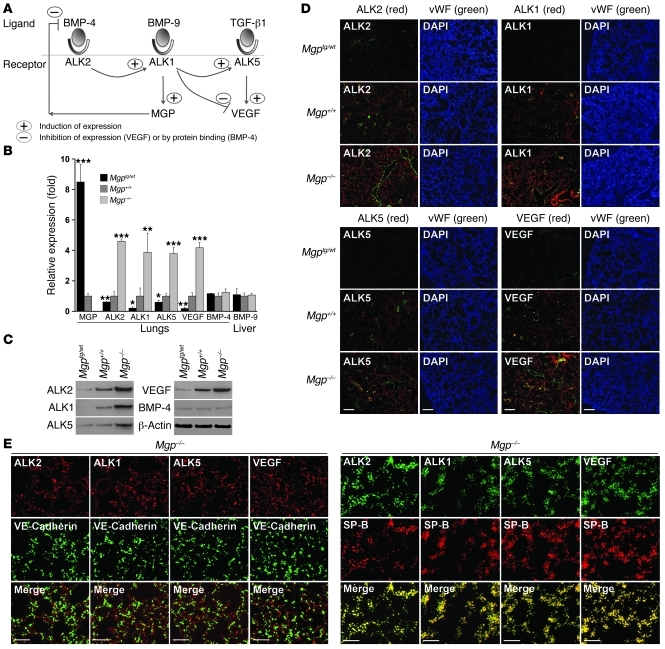
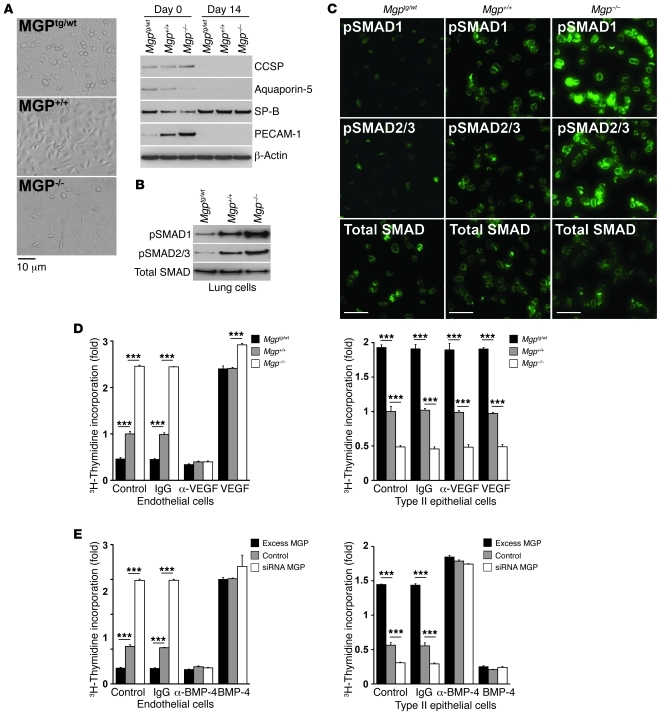
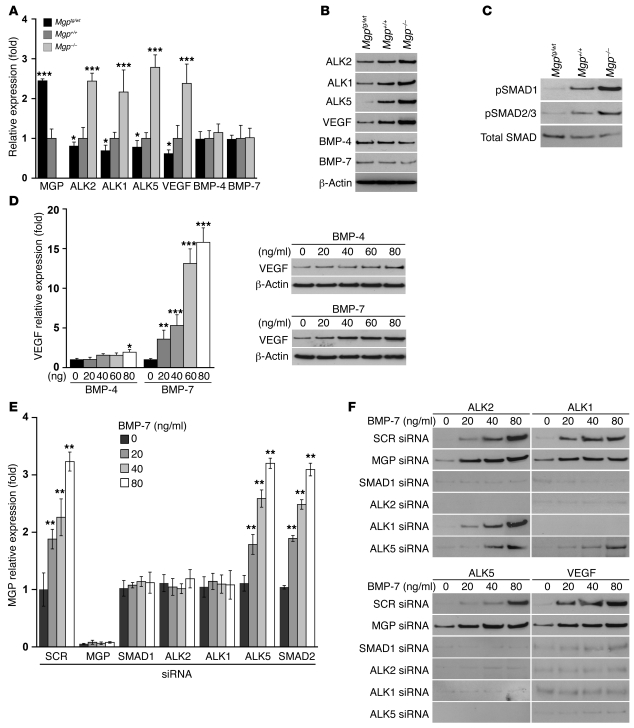
Arteriovenous malformations (AVMs) in organs, such as the lungs, intestine, and brain, are characteristic of hereditary hemorrhagic telangiectasia (HHT), a disease caused by mutations in activin-like kinase receptor 1 (ALK1), which is an essential receptor in angiogenesis, or endoglin. Matrix Gla protein (MGP) is an antagonist of BMPs that is highly expressed in lungs and kidneys and is regulated by ALK1. The objective of this study was to determine the role of MGP in the vasculature of the lungs and kidneys. We found that Mgp gene deletion in mice caused striking AVMs in lungs and kidneys, where overall small organ size contrasted with greatly increased vascularization. Mechanistically, MGP deficiency increased BMP activity in lungs. In cultured lung epithelial cells, BMP-4 induced VEGF expression through induction of ALK1, ALK2, and ALK5. The VEGF secretion induced by BMP-4 in Mgp-/- epithelial cells stimulated proliferation of ECs. However, BMP-4 inhibited proliferation of lung epithelial cells, consistent with the increase in pulmonary vasculature at the expense of lung tissue in the Mgp-null mice. Similarly, BMP signaling and VEGF expression were increased in Mgp-/- mouse kidneys. We therefore conclude that Mgp gene deletion is what we believe to be a previously unidentified cause of AVMs. Because lack of MGP also causes arterial calcification, our findings demonstrate that the same gene defect has drastically different effects on distinct vascular beds.


Figures

Figure 1
Figure 1. MGP levels influence pulmonary vascular development.
(A) Photographs of lungs and micro CT images of the pulmonary vasculature from Mgptg/wt, Mgp+/+, and Mgp–/– mice. Data are from a single experiment but are representative of 3 repeat experiments. Stars represent visualized pulmonary veins. See Supplemental Videos 1–3 for full 3D reconstruction of the pulmonary vasculature. Microfil compound was used for organ perfusion in order to visualize the vasculature. (B) Expression of vWF in lung sections from Mgptg/wt, Mgp+/+, and Mgp–/– mice, as determined by immunofluorescence (n = 3). Arrowheads indicate vWF-positive endothelium. (C) Presence of pulmonary arteriovenous shunts, as shown by UV-fluorescent microsphere passage. The microspheres bypassed the lungs in the Mgp–/– mice. BF, bright field. (D) Niduses of enlarged and tortuous blood vessels in Mgp–/– lung (left panels). Direct arteriovenous (AV) connections on the surface of a Mgp–/– lung (right panel). (E) Vessel density in lungs from Mgptg/wt, Mgp+/+, and Mgp–/– mice (n = 6). The left panel shows total vessel density, and the right panel shows vessel density of vessels with a caliber of less than 20 μm and more than 20 μm. (F) Expression of PECAM-1 and Ephrin B2 in lung tissues from Mgptg/wt, Mgp+/+, and Mgp–/– mice, as determined by real-time PCR and immunoblotting. Asterisks indicate statistically significant differences compared with wild-type (Mgp+/+). **P < 0.01, ***P < 0.001, Tukey’s test. Scale bars: 2 mm (A, rows 1–3, and C); 500 μm (A, row 4, and D, left and middle); 100 μm (B and D, right).
Figure 2
Figure 2. MGP levels influence renal vascular development.
(A) Photographs of kidneys and micro CT images of the renal vasculature from Mgptg/wt, Mgp+/+, and Mgp–/– mice. Data are from a single experiment but are representative of 3 repeat experiments. Stars represent visualized pulmonary veins. See Supplemental Videos 4–6 for full 3D reconstruction of the renal vasculature. (B) Expression of vWF in kidney sections from Mgptg/wt, Mgp+/+, and Mgp–/– mice, as determined by immunofluorescence (n = 3). (C) Presence of renal arteriovenous shunts, as shown by UV-fluorescent microsphere passage. The microspheres bypassed the kidneys in the Mgp–/– mice. (D) Nidus of enlarged and tortuous blood vessels in Mgp–/– kidney (left panels). Both afferent and efferent arterioles are apparent in Mgp–/– kidneys but not in Mgp+/+ kidneys (right panels). (E) Vessel density in kidneys from Mgptg/wt, Mgp+/+, and Mgp–/– mice (n = 6). The left panel shows total vessel density, and the right panel shows vessel density of vessels with a caliber of less than 20 μm and more than 20 μm. (F) Expression of PECAM-1 and Ephrin B2 in kidney tissues from Mgptg/wt, Mgp+/+, and Mgp–/– mice, as determined by real-time PCR and immunoblotting. Asterisks indicate statistically significant differences compared with wild-type (Mgp+/+) mice. *P < 0.05, **P < 0.01, ***P < 0.001, Tukey’s test. Scale bars: 1 mm (A, rows 1–3, C, and D, left image); 200 μm (A, row 4); 50 μm (B and D, right center and right images); 500 μm (D, left center image).
Figure 3
Figure 3. BMP activity increases as MGP levels decrease in lung tissue.
(A) pSMAD1 and pSMAD2/3 in lung tissue from Mgptg/wt, Mgp+/+, and Mgp–/– mice, as determined by immunoblotting, compared with total SMAD. (B) Colocalization of pSMAD1 and pSMAD2/3 with VE-cadherin (EC marker) and SP-B (marker for type II epithelial lung cells) in lung sections from Mgptg/wt, Mgp+/+, and Mgp–/– mice. Scale bars: 10 μm (B).
Figure 4
Figure 4. BMP-regulated gene expression is increased in MGP-deficient lungs.
(A) Schematic outline of the BMP-4 induced pathway in ECs. (B and C) Expression of MGP, ALK2, ALK1, ALK5, VEGF, and BMP-4 in lung tissue and BMP-9 in liver from Mgptg/wt, Mgp+/+, and Mgp–/– mice, as determined by real-time PCR and immunoblotting. Asterisks indicate statistically significant differences compared with wild-type (Mgp+/+) mice. *P < 0.05, **P < 0.01, ***P < 0.001, Tukey’s test. (D) Costaining of ALK2, ALK1, ALK5, and VEGF with vWF in lung sections from Mgptg/wt, Mgp+/+, and Mgp–/– mice. (E) Costaining of ALK2, ALK1, ALK5, and VEGF with VE-Cadherin (left) or SP-B (right) in lung sections from Mgp–/– mice. Scale bars: 100 μm (D); 10 μm (E).
Figure 5
Figure 5. SMAD activation and proliferation in ECs versus that in type II epithelial lung cells.
(A) Lung cells that were cultured for 14 days (shown by phase-contrast microscopy, left) retained expression of SP-B (type II epithelial cell marker), as shown by immunoblotting (right), but not of CCSP (Clara cell marker), AQP-5 (type I epithelial cell marker), or PECAM-1 (EC marker). (B and C) pSMAD1 and pSMAD2/3 in SP-B–expressing type II epithelial cells from Mgptg/wt, Mgp+/+ and Mgp–/– mice, as determined by (B) immunoblotting and (C) immunofluorescence, compared with total SMAD. (D) Cell proliferation in HAECs (left panel) and type II epithelial cells from wild-type mice (right panel) in response to conditioned media from type II epithelial cells isolated from Mgptg/wt, Mgp+/+, and Mgp–/– mice. Cells were treated with control vehicle, anti-VEGF antibodies or nonspecific IgG (300 ng/ml), or VEGF (10 ng/ml). Asterisks indicate statistically significant differences. ***P < 0.001, Tukey’s test. (E) Cell proliferation in HAECs (left panel) and type II epithelial cells from wild-type mice (right panel) in response to conditioned media from BAECs transfected with N-FLAG-hMGP expression vector (excess MGP), empty expression vector (control), or HAECs depleted of MGP (siRNA MGP). Cells were treated with control vehicle, anti–BMP-4 antibodies or nonspecific IgG (300 ng/ml), or BMP-4 (40 ng/ml). Asterisks indicate statistically significant differences. ***P < 0.001, Tukey’s test. Scale bars: 10 μm (C).
Figure 6
Figure 6. BMP-regulated gene expression is increased in MGP-deficient kidneys.
(A and B) Expression of MGP, ALK2, ALK1, ALK5, VEGF, BMP-4, and BMP-7 in kidneys from Mgptg/wt, Mgp+/+, and Mgp–/– mice, as determined by (A) real-time PCR and (B) immunoblotting. (C) pSMAD1 and pSMAD2/3 and total SMAD in kidneys from Mgptg/wt, Mgp+/+, and Mgp–/– mice, as determined by immunoblotting, compared with total SMAD. (D) VEGF expression in renal mesangial cells after treatment with BMP-4 or BMP-7 (0–80 ng/ml), as determined by real-time PCR and immunoblotting. (E and F) Expression of MGP after transfection of scrambled siRNA or siRNA to MGP, SMAD1, ALK2, ALK1, ALK5, and SMAD2 in mesangial cells and treatment with BMP-7 (0–80 ng/ml), as determined by (E) real-time PCR and (F) immunoblotting. Treatment was started 24 hours after transfection and lasted 24 hours. Asterisks indicate statistically significant differences compared with control (no BMP-7). SCR, scrambled control. *P < 0.05, **P < 0.01, ***P < 0.001, Tukey’s test.

References

    1. Zebboudj AF, Imura M, Bostrom K. Matrix GLA protein, a regulatory protein for bone morphogenetic protein-2. J Biol Chem. 2002;277(6):4388–4394. doi: 10.1074/jbc.M109683200. - DOI - PubMed
    1. Yao Y, Shahbazian A, Bostrom KI. Proline and gamma-carboxylated glutamate residues in matrix Gla protein are critical for binding of bone morphogenetic protein-4. Circ Res. 2008;102(9):1065–1074. doi: 10.1161/CIRCRESAHA.107.166124. - DOI - PubMed
    1. Wallin R, Cain D, Hutson SM, Sane DC, Loeser R. Modulation of the binding of matrix Gla protein (MGP) to bone morphogenetic protein-2 (BMP-2). Thromb Haemost. 2000;84(6):1039–1044. - PubMed
    1. Luo G, et al. Spontaneous calcification of arteries and cartilage in mice lacking matrix GLA protein. Nature. 1997;386(6620):78–81. doi: 10.1038/386078a0. - DOI - PubMed
    1. Speer MY, et al. Smooth muscle cells give rise to osteochondrogenic precursors and chondrocytes in calcifying arteries. Circ Res. 2009;104(6):733–741. doi: 10.1161/CIRCRESAHA.108.183053. - DOI - PMC - PubMed

Publication types

MeSH terms