

doi: 10.1038/nmeth.1650.
Bayesian community-wide culture-independent microbial source tracking
Affiliations
- PMID: 21765408
- PMCID: PMC3791591
- DOI: 10.1038/nmeth.1650
Item in Clipboard
Bayesian community-wide culture-independent microbial source tracking
Nat Methods.
.
Abstract
Contamination is a critical issue in high-throughput metagenomic studies, yet progress toward a comprehensive solution has been limited. We present SourceTracker, a Bayesian approach to estimate the proportion of contaminants in a given community that come from possible source environments. We applied SourceTracker to microbial surveys from neonatal intensive care units (NICUs), offices and molecular biology laboratories, and provide a database of known contaminants for future testing.
Figures
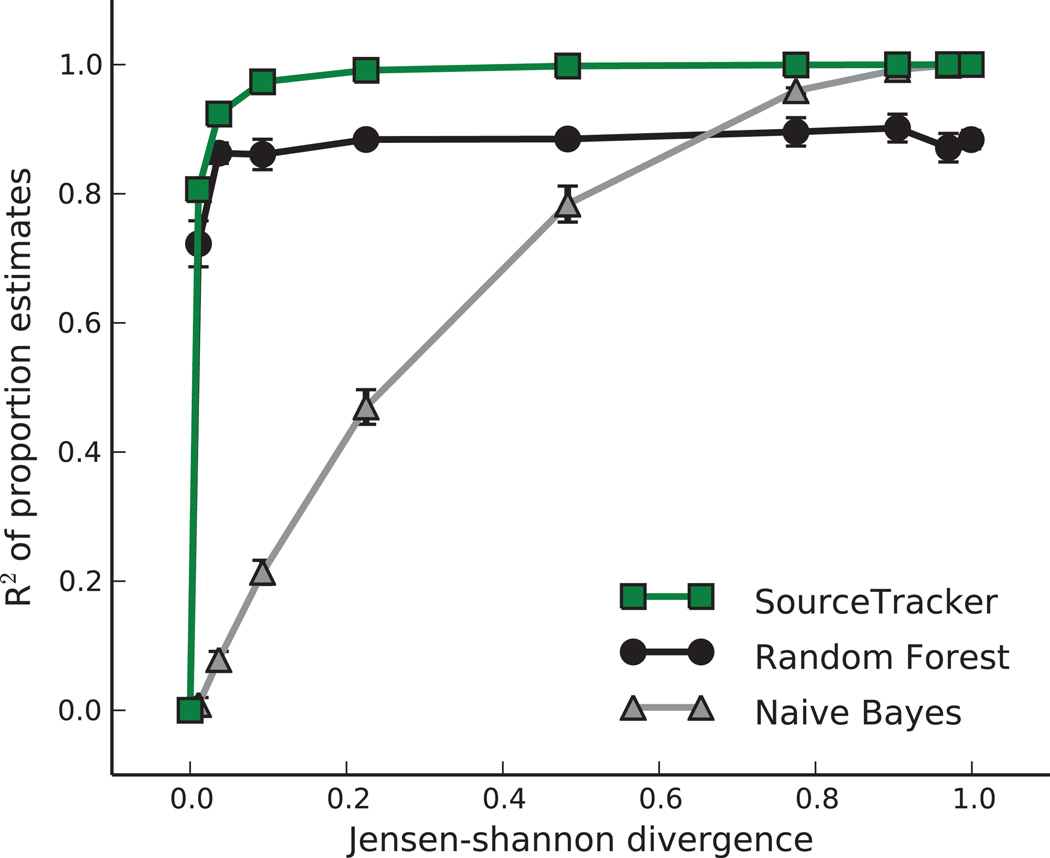
Three models were used to estimate the proportions of two source environments in a set of simulated samples, as the degree of overlap between the environments was varied from a Jensen-Shannon divergence (JSD) of 0 (completely identical, and thus impossible to disambiguate), to a JSD of 1 (completely non-overlapping, and thus trivial to disambiguate). The coefficients of determination (R2) of the estimated proportions are plotted. Each point represents the mean R2 for three trials of 100 samples each; error bars show s.e.m. (n = 3).
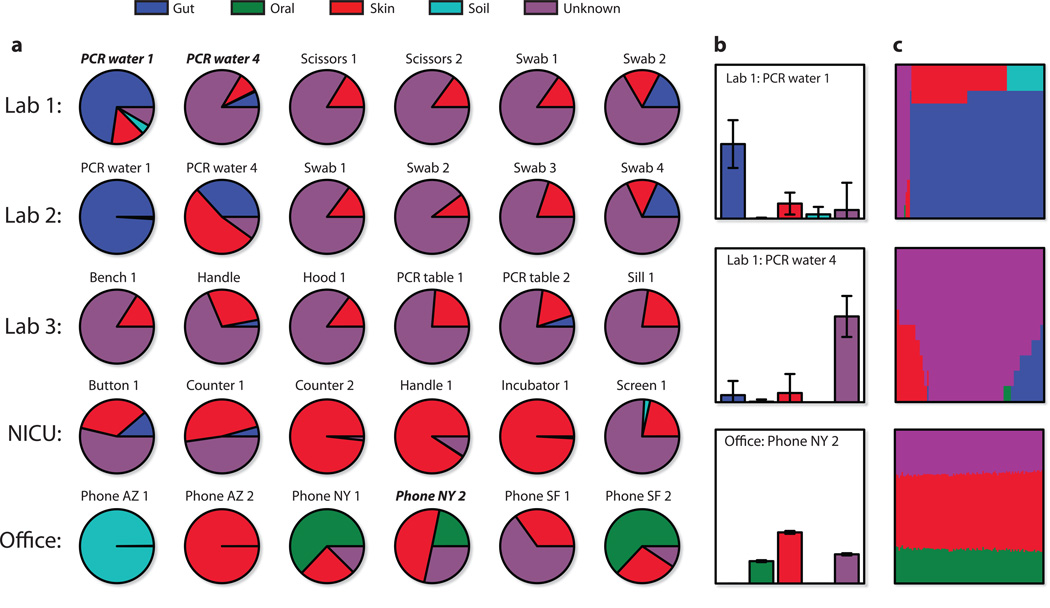
Source environment proportions were estimated using SourceTracker and 45 training samples from each source environment. (a) Pie charts of the mean proportions for 100 draws from Gibbs sampling. (b) Bar charts for three samples including standard deviations of the proportion estimates. (c) Direct visualization of 100 Gibbs draws for the samples in (b); each column shows the mixture from one draw, with columns sorted by the most prevalent source. The first sample, Lab 1: PCR water 1, shows several possible mixtures: all Unknown; Gut and Skin (most common); and Gut and Soil. The second sample shows poor disambiguation between Gut, Skin, and Unknown. Most mixtures were stable like the third sample; the first two were chosen for demonstrative purposes.
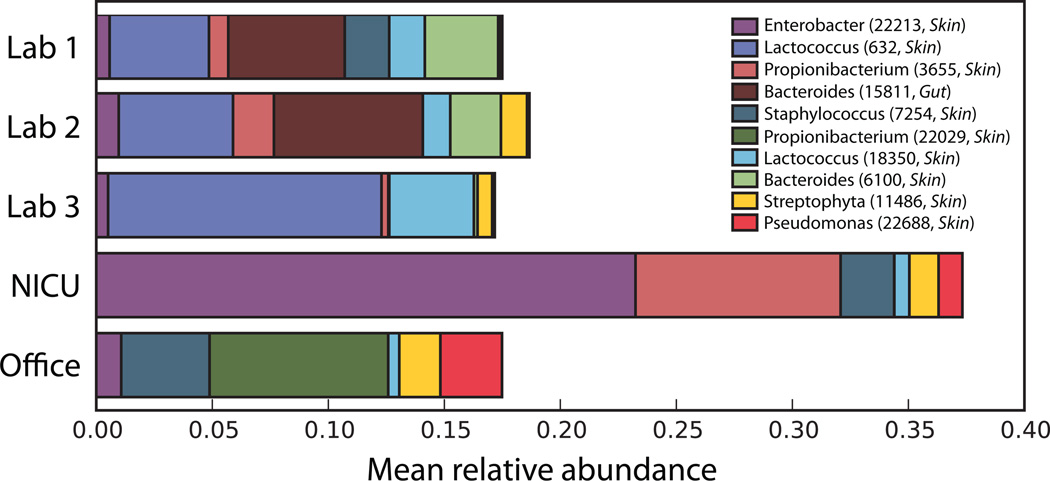
For all sink sequences assigned to a known source environment (Gut, Oral, Skin, or Soil) by SourceTracker, these ten OTUs had the highest average relative abundance across sink environments. Note that the OTU classified as Enterobacter, a lineage commonly seen in the gut, was more prevalent in the Skin training samples than the Gut training samples.
References
Publication types
MeSH terms
Grants and funding
LinkOut - more resources
Full Text Sources
Other Literature Sources
