. 2011 Jul 17;12(9):888-97.
doi: 10.1038/ni.2068.

The tumor suppressor Tsc1 enforces quiescence of naive T cells to promote immune homeostasis and function

Affiliations

The tumor suppressor Tsc1 enforces quiescence of naive T cells to promote immune homeostasis and function

Kai Yang et al. Nat Immunol. .

Abstract

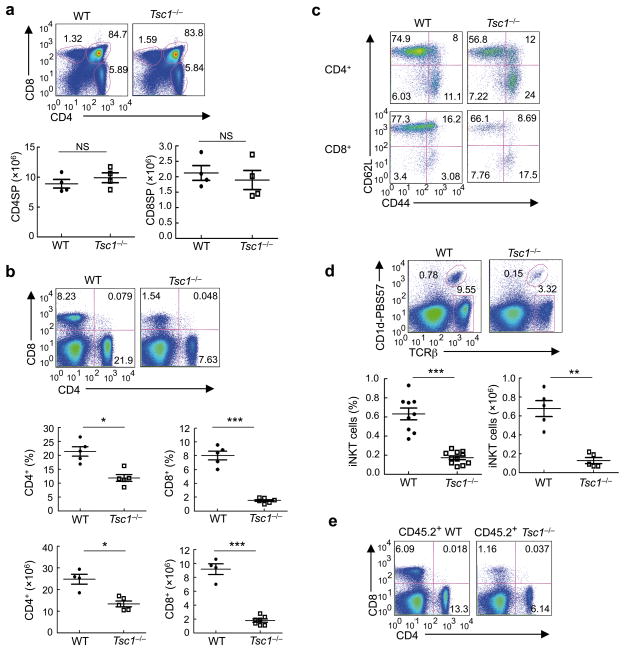
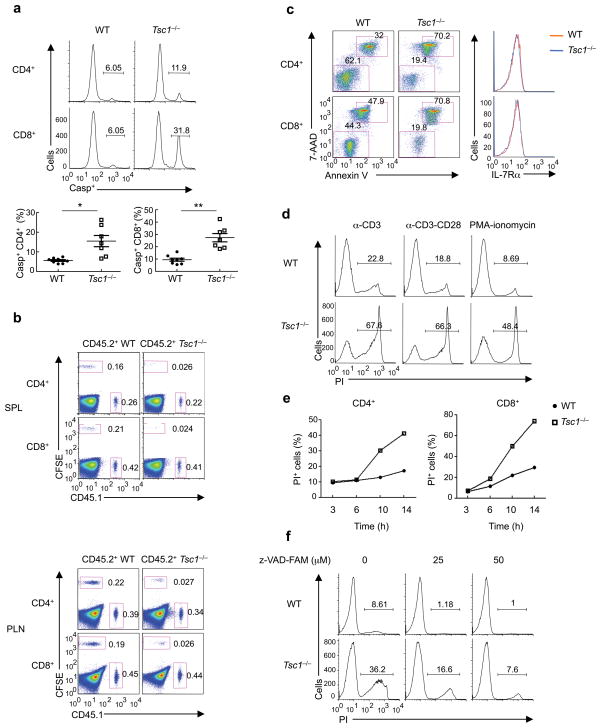
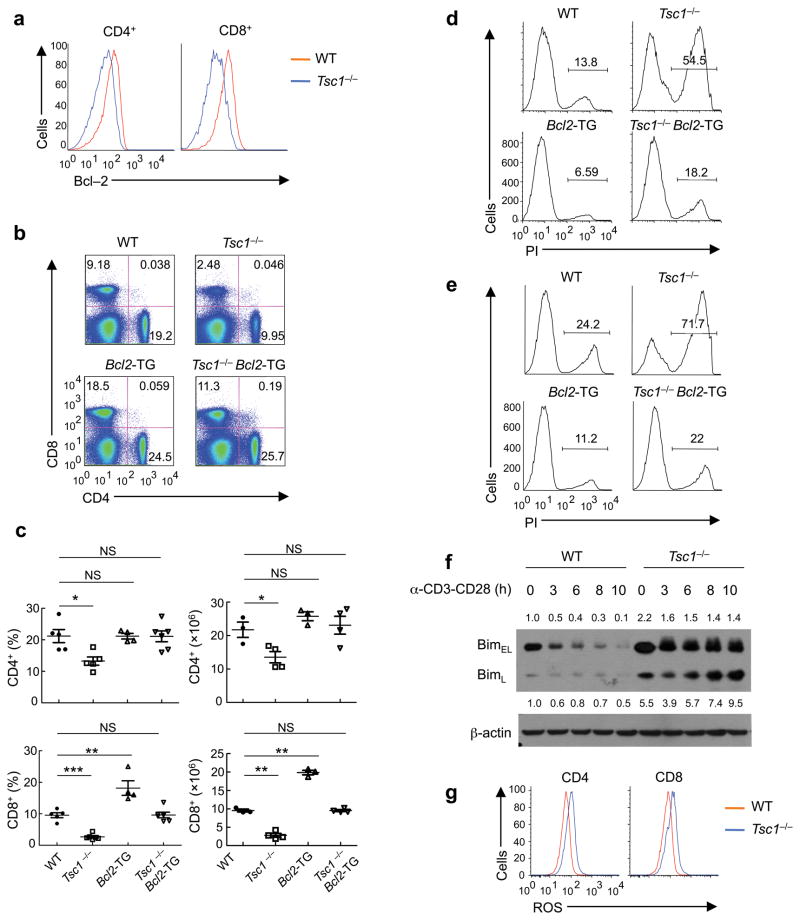
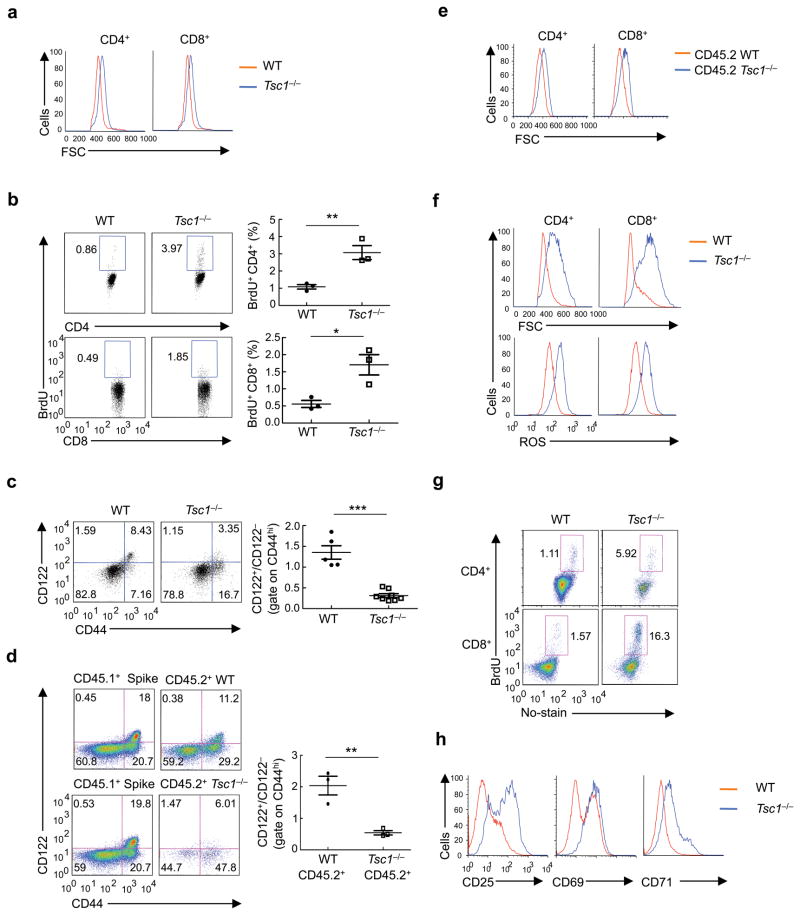
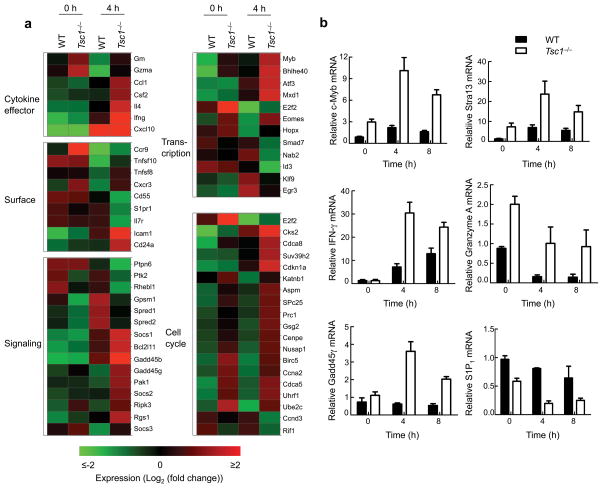
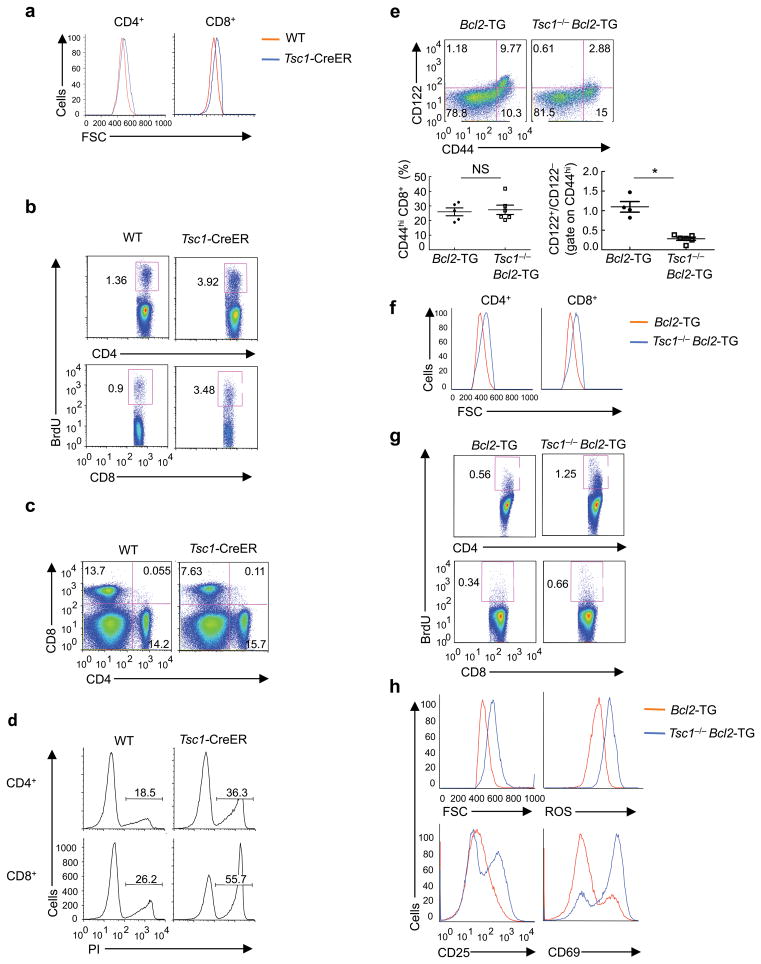
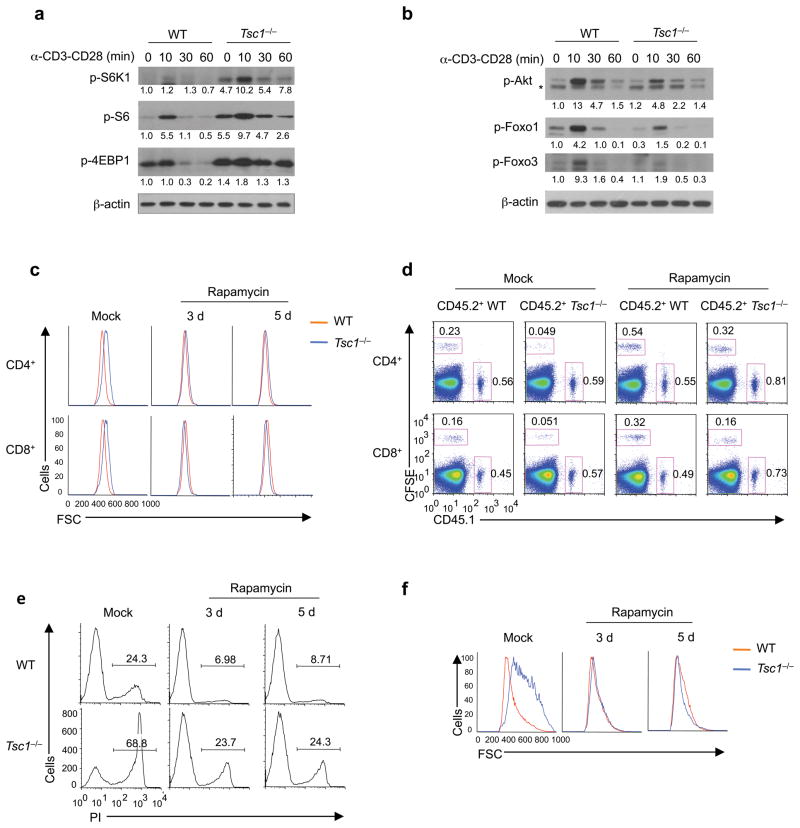
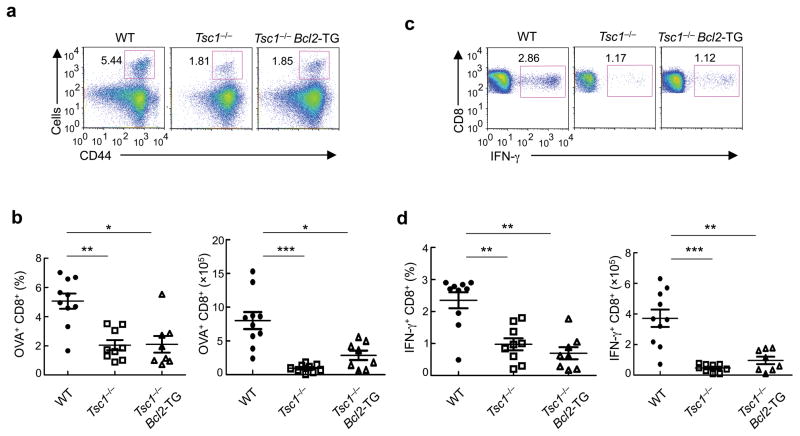
The mechanisms that regulate T cell quiescence are poorly understood. We report that the tumor suppressor Tsc1 established a quiescence program in naive T cells by controlling cell size, cell cycle entry and responses to stimulation of the T cell antigen receptor. Abrogation of quiescence predisposed Tsc1-deficient T cells to apoptosis that resulted in loss of conventional T cells and invariant natural killer T cells. Loss of Tsc1 function dampened in vivo immune responses to bacterial infection. Tsc1-deficient T cells had more activity of the serine-threonine kinase complex mTORC1 but less mTORC2 activity, and activation of mTORC1 was essential for the disruption of immune homeostasis. Therefore, Tsc1-dependent control of mTOR is crucial in actively maintaining the quiescence of naive T cells to facilitate adaptive immune function.


Figures

Figure 1
Figure 1. Tsc1 deficiency leads to disrupted homeostasis of peripheral T cell pools
(a) Flow cytometry of thymocytes in wild-type (WT) and Tsc1−/− mice. Lower panels, numbers of CD4SP and CD8SP thymocytes (n=4–7). (b) Flow cytometry of CD4 and CD8 T cells in the spleens of WT and Tsc1−/− mice. Lower panels, proportions and absolute numbers of CD4 and CD8 T cells in the spleens of WT and Tsc1−/− mice (n=4–6). (c) CD62L and CD44 expression on splenic T cells of WT and Tsc1−/− mice. (d) Flow cytometry of iNKT cells (TCRβ+CD1d-PBS57+) in the spleens of WT and Tsc1−/− mice (n≥5). (e) Flow cytometry of CD4 and CD8 T cells in the spleens of mixed BM chimeras. BM stem cells from wild-type (CD45.1+) and WT or Tsc1−/−mice (CD45.2+) were mixed at 1:1, and transferred into sublethally irradiated Rag1−/− mice to generate mixed BM chimeras, followed by analysis at 8 weeks after reconstitution. NS, not significant; * P < 0.005; ** P < 0.0005; *** P < 0.0001. Data are representative of 4 (a–d) and 2 (e) independent experiments.
Figure 2
Figure 2. Tsc1 deletion results in markedly elevated apoptosis of T cells
(a) Caspase activity by FITC-VAD-FMK staining in freshly isolated WT and Tsc1−/− T cells. Lower panels, proportions of caspase-positive (Casp+) T cells (n=7–8). * P <0.005; ** P < 0.0005. (b) Flow cytometry of spleen (upper) and lymph node (lower) cells in the recipient mice (CD45.2+) 6 days after adoptive transfer of equal numbers of CD45.1+ (spike) cells and WT or Tsc1−/− donor cells (CFSE-labeled). SPL, spleen; PLN, peripheral lymph nodes. (c) Annexin V and 7-AAD staining in naive WT or Tsc1−/− T cells cultured with IL-7 in vitro for 3days (left), and expression of IL-7Rα on freshly isolated cells (right). (d) Detection of PI+ apoptotic cells after 16 hours of stimulation of CD8 T cells with anti-CD3, anti-CD3-CD28, or PMA-ionomycin. (e) Kinetics of apoptosis (measured by frequency of PI+ apoptotic cells) after anti-CD3-CD28 stimulation of CD4 and CD8 T cells. (f) Detection of PI+ apoptotic cells in WT and Tsc1−/− CD8 T cells pretreated with vehicle or caspase inhibitor Z-VAD-FAM for 1 hour and then activated with anti-CD3-CD28 for 10 hours. Although not shown here, similar results were observed in CD4 T cells (d,f). Data are representative of 4 (a,c), 2 (b,e), 5 (d) and 3 (f) independent experiments.
Figure 3
Figure 3. Tsc1-deficient T cells die via the Bcl-2 family-dependent intrinsic apoptotic pathway
(a) Intracellular Bcl-2 expression in WT and Tsc1−/− T cells. (b) Flow cytometry of CD4 and CD8 T cells in the spleens of WT, Tsc1−/−, Bcl2-TG, and Tsc1−/− Bcl2-TG mice. (c) Proportions and absolute numbers of CD4 and CD8 T cells in WT, Tsc1−/−, Bcl2-TG, and Tsc1−/−Bcl2-TG spleens (n=3–6). NS, not significant; * P <0.05; ** P < 0.005; *** P< 0.0001. (d,e) Detection of PI+ apoptotic cells after 16 hours of stimulation of CD4 (d) and CD8 (e) cells with anti-CD3-CD28. (f) Expression of BimEL and BimL in naive and anti-CD3-CD28 activated WT and Tsc1−/− CD4 T cells. Numbers above (BimEL) and below (BimL) lanes indicate band intensity relative to that of the loading control-actin. (g) ROS production in freshly isolated WT and Tsc1−/− T cells. Data are representative of 3 (a,d–g) and 4 (b,c) independent experiments.
Figure 4
Figure 4. Tsc1 deficiency causes cell-autonomous loss of quiescence in vivo and hyperactive responses to TCR stimulation
(a) Cell size of freshly isolated WT and Tsc1−/− T cells. FSC, forward scattering. (b) BrdU staining in splenocytes of WT and Tsc1−/− mice 16 hours after injection with BrdU (n=3). (c) CD122 and CD44 expression on gated CD8 splenocytes of WT and Tsc1−/− mice. Right, ratios of CD122+/CD122 among CD44hi populations (n=5–8). (d) CD122 and CD44 expression on gated CD8 splenocytes in the mixed BM chimeras generated as in Fig. 1e. Right, ratios of CD122+/CD122 cells among CD44hi populations of the CD45.2+ cells (n=3). (e) Cell size of CD45.2+ cells in the mixed BM chimeras. (f) Flow cytometry of WT and Tsc1−/− naive T cells after stimulation with anti-CD3-CD28 for 16 hours for the measurements of cell size (upper) and ROS production (lower). (g) BrdU staining in naive T cells activated with anti-CD3-CD28 for 20 hours, followed by pulsing with BrdU for 90 min. (h) Expression of activation markers in WT and Tsc1−/− naive T cells after stimulation with anti-CD3-CD28 for 16 hours. * P <0.05; ** P < 0.01; *** P< 0.0001. Data are representative of 5 (a,c,f), 3 (b,d,e,g), and 4 (h) independent experiments.
Figure 5
Figure 5. Tsc1-dependent gene expression programs
(a) A subset of genes differentially regulated in WT and Tsc1−/− CD4 T cells activated with TCR for 4 hours (≥ 2-fold difference with false discovery rate <0.1). Triplicate samples were used in the analysis. (b) Real-time PCR analysis of selected genes in WT and Tsc1−/− CD4 T cells activated for various times. Data are representative of 2 independent experiments.
Figure 6
Figure 6. Loss of T cell quiescence results from inducible deletion of Tsc1 and is independent of cell survival
(a–d) Analyses of WT and Tsc1-CreER mice at 2 weeks after tamoxifen injection, for cell size of freshly isolated T cells (a), BrdU staining in splenocytes of mice 16 hours after injection with BrdU (b), splenic T cell populations (c), and PI+ apoptotic cells after 16 hours of anti-CD3-CD28 stimulation of naive T cells (d). (e–h) Analyses of WT and Tsc1−/− mice expressing the Bcl2 transgene, for expression of CD122 and CD44 on gated CD8 splenocytes (lower left, proportions of total CD44hi populations; lower right, ratios of CD122+/CD122 populations among CD44hi cells, n=4–6) (e), cell size of freshly isolated T cells (f), and BrdU staining in splenocytes of mice 16 hours after injection with BrdU (g). (h) Flow cytometry of naive T cells after stimulation with anti-CD3-CD28 for 16 hours for the measurements of cell size, ROS production, and expression of CD25 and CD69. NS, not significant; * P = 0.0001. Data are representative of 2 (a–d,h), 4 (e,f), and 3 (g) independent experiments.
Figure 7
Figure 7. Tsc1 regulates mTORC1 and mTORC2 activities, with mTORC1 activation essential to disrupt immune quiescence and homeostasis
(a) Phosphorylation of S6K1, S6 and 4EBP1 in WT and Tsc1−/− naive CD4 T cells after they were stimulated with anti-CD3-CD28 for various times. (b) Phosphorylation of Akt (Ser473), Foxo1 and Foxo3 in WT and Tsc1−/−CD4 T cells after they were stimulated with anti-CD3-CD28 for various times. *, non-specific bands. Numbers below lanes (a,b) indicate band intensity relative to that of the loading control β-actin. (c) Cell size of freshly isolated splenocytes after WT and Tsc1−/− mice were treated with daily injection of rapamycin for a total of 3 or 5 days. (d) Flow cytometry of splenocytes in the recipient mice (CD45.2+) 6 days after adoptive transfer of equal numbers of CD45.1+ (spike) cells and WT or Tsc1−/− donor cells (CFSE-labeled) that were purified from mock or rapamycin-treated mice. Similar results were obtained in the recipient lymph nodes (not shown here). (e,f) Naive T cells from rapamycin or mock treated WT and Tsc1−/− mice were stimulated with anti-CD3-CD28 overnight, followed by measurements of PI+ apoptotic cells (e) and cell size (f). Data are representative of 5 (a,b) and 3 (c–f) independent experiments.
Figure 8
Figure 8. Tsc1 deficiency dampens antibacterial immune response in vivo
(a,b) Flow cytometry (a) and proportions and absolute numbers (b) of OVA-reactive tetramer-positive CD8 T cells in WT, Tsc1−/− and Tsc1−/− Bcl2-TG mice infected with LM-OVA. (c,d) Flow cytometry (c) and proportions and absolute numbers (d) of OVA-reactive IFN-γ+ CD8 T cells in LM-OVA infected mice, detected after OVA stimulation and intracellular cytokine staining. * P <0.005; ** P < 0.001; *** P< 0.0001. Data are representative of 3 independent experiments (n=8–10).

Comment in

References

    1. Hedrick SM, Ch’en IL, Alves BN. Intertwined pathways of programmed cell death in immunity. Immunol Rev. 2010;236:41–53. - PMC - PubMed
    1. Surh CD, Sprent J. Homeostasis of naive and memory T cells. Immunity. 2008;29:848–862. - PubMed
    1. Takada K, Jameson SC. Naive T cell homeostasis: from awareness of space to a sense of place. Nat Rev Immunol. 2009;9:823–832. - PubMed
    1. Glynne R, Ghandour G, Rayner J, Mack DH, Goodnow CC. B-lymphocyte quiescence, tolerance and activation as viewed by global gene expression profiling on microarrays. Immunol Rev. 2000;176:216–246. - PubMed
    1. Teague TK, et al. Activation changes the spectrum but not the diversity of genes expressed by T cells. Proc Natl Acad Sci U S A. 1999;96:12691–12696. - PMC - PubMed

Publication types

MeSH terms

Associated data