. 2011 Jul;96(1):39-61.
doi: 10.1901/jeab.2011.96-39.

Contingent stimuli signal subsequent reinforcer ratios

Affiliations

Contingent stimuli signal subsequent reinforcer ratios

Nathalie Boutros et al. J Exp Anal Behav. 2011 Jul.

Abstract

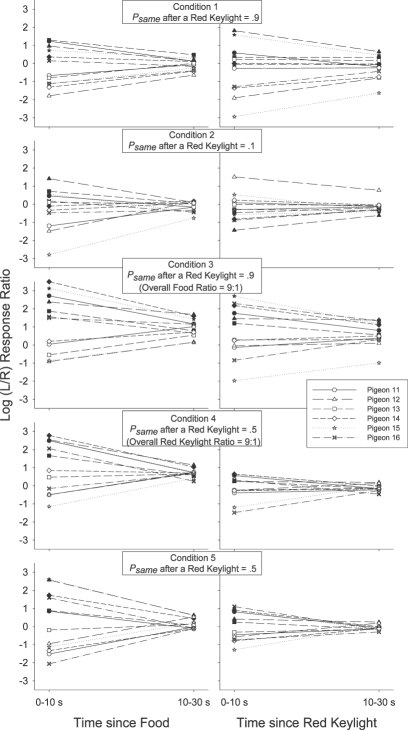
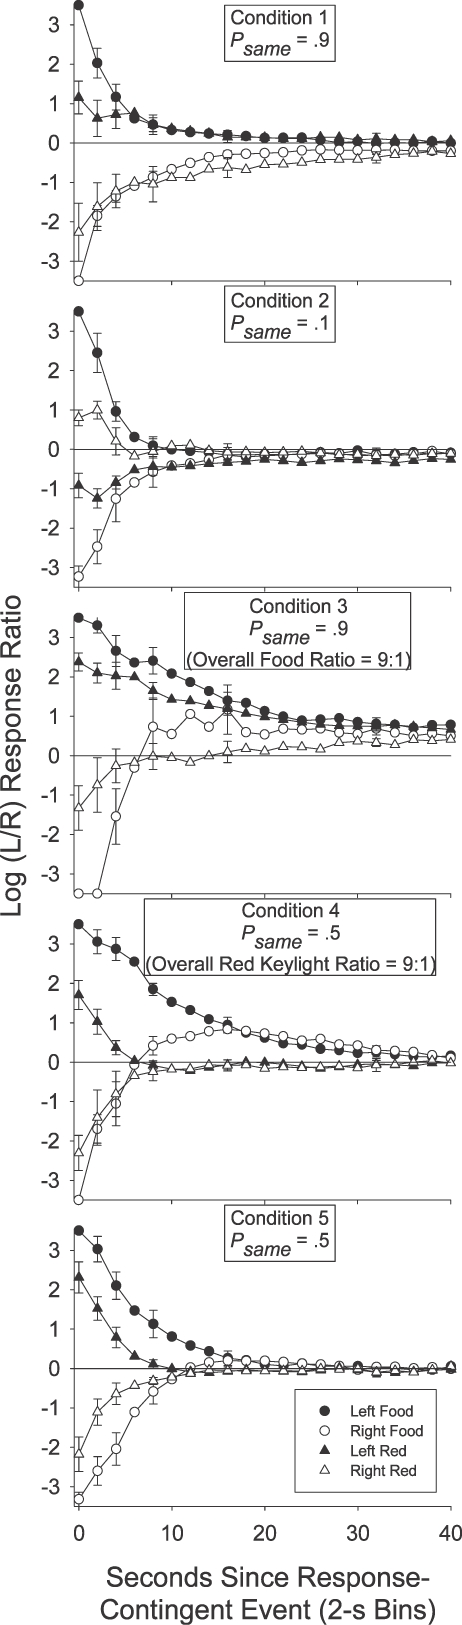
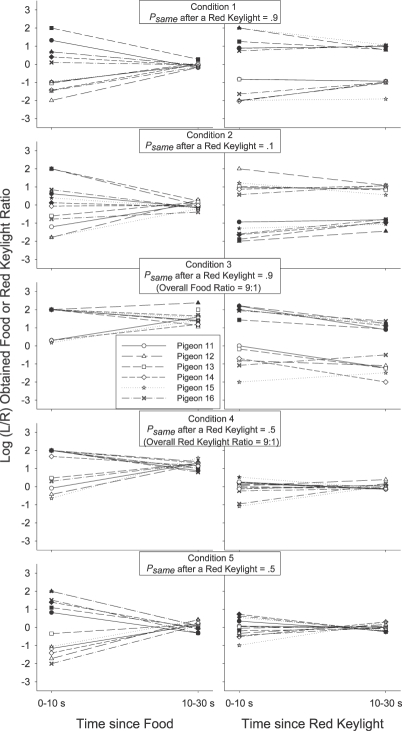
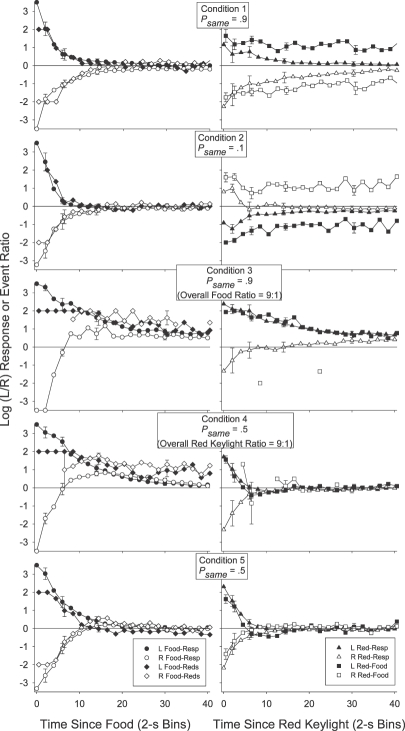
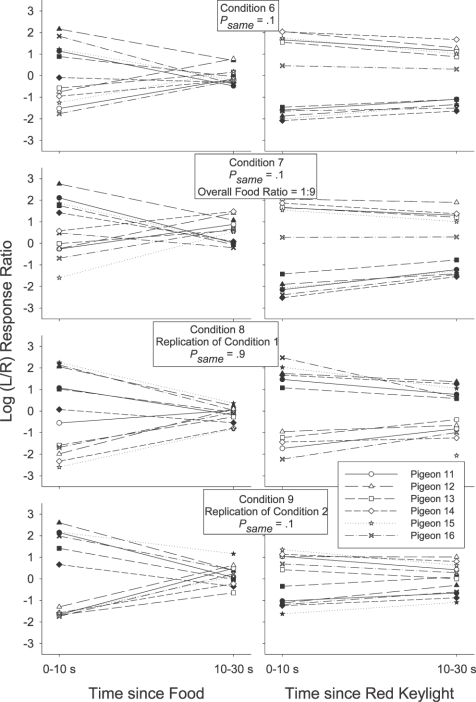
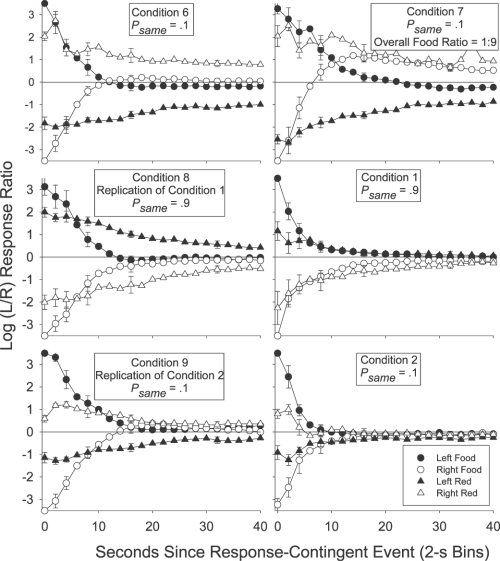
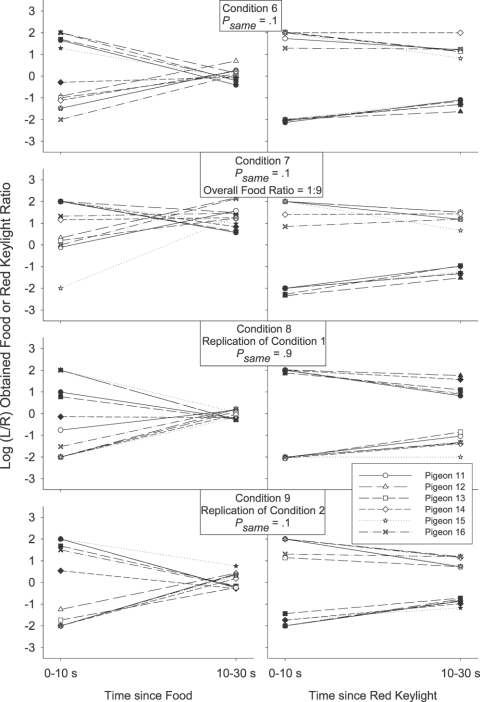
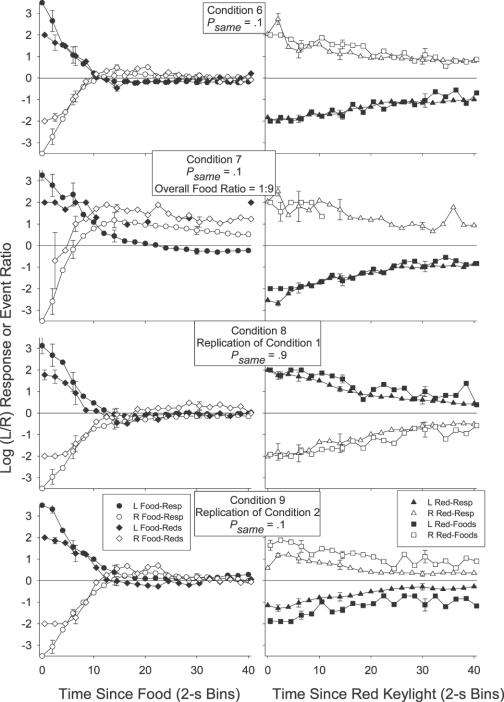
Conditioned reinforcer effects may be due to the stimulus' discriminative rather than its strengthening properties. While this was demonstrated in a frequently-changing choice procedure, a single attempt to replicate in a relatively static choice environment failed. We contend that this was because the information provided by the stimuli was nonredundant in the frequently-changing preparation, and redundant in the steady-state arrangement. In the present experiments, 6 pigeons worked in a steady-state concurrent schedule procedure with nonredundant informative stimuli (red keylight illuminations). When a response-contingent red keylight signaled that the next food delivery was more likely on one of the two alternatives, postkeylight choice responding was reliably for that alternative. This effect was enhanced after a history of extended informative red keylight presentation (Experiment 2). These results lend support to recent characterizations of conditioned reinforcer effects as reflective of a discriminative, rather than a reinforcing, property of the stimulus.

Keywords: choice; conditional reinforcer; key peck; local analyses; pigeon; preference pulse.


Figures

Fig 1
Fig 1
Log (L/R) response ratio 0 to 10 s and 10 to 30 s after a response-contingent food delivery (left panels) or red keylight (right panels) for each individual subject in each condition of Experiment 1. Filled symbols depict preference after a left event (food or red keylight) and unfilled symbols depict preference after a right event.
Fig 2
Fig 2
Group mean log (L/R) response ratio in successive 2-s time bins after each of the four response-contingent events in each condition of Experiment 1. Error bars (±1 standard error) are plotted at representative data points, first at time bin 0, and then in each time bin increasing in log2 units.
Fig 3
Fig 3
Log (L/R) response-contingent event ratio 0 to 10 s and 10 to 30 s after a response-contingent food delivery (left panels) or red keylight (right panels) for each individual subject in each condition of Experiment 1. Filled symbols depict event (food or red keylight) ratios after a left event and unfilled symbols depict event ratios after a right event.
Fig 4
Fig 4
Group mean log (L/R) response and response-contingent event ratios in successive 2-s time bins after a response-contingent food delivery (left panels) or red keylight (right panels) in each condition of Experiment 1. Error bars (±1 standard error) are plotted at representative data points, first at time bin 0, and then increasing in log2 units. The contingent-event pulses are shifted to the right of the response pulses by .5 s on the x-axis in order to aid comparison. The preference (behavior) pulses in this figure are reprinted from Figure 2.
Fig 5
Fig 5
Log (L/R) response ratio 0 to 10 s and 10 to 30 s after a response-contingent food delivery (left panels) or red keylight (right panels) for each individual subject in each condition of Experiment 2. Filled symbols depict preference after a left event (food or red keylight) and unfilled symbols depict preference after a right event.
Fig 6
Fig 6
Group mean log (L/R) response ratio in successive 2-s time bins after each of the four response-contingent events in each condition of Experiment 2. Preference pulses from Conditions 1 and 2 (Experiment 1) are reprinted to aid evaluation of the replication. Error bars (±1 standard error) are plotted at representative data points, first at time bin 0, and then in each time bin increasing in log2 units.
Fig 7
Fig 7
Log (L/R) response-contingent event ratio 0 to 10 s and 10 to 30 s after a response-contingent food delivery (left panels) or red keylight (right panels) for each individual subject in each condition of Experiment 2. Filled symbols depict event (food or red ke ylight) ratios after a left event and unfilled symbols depict event ratios after a right event.
Fig 8
Fig 8
Group mean log (L/R) response and response-contingent event ratios in successive 2-s time bins after a response-contingent food delivery (left panels) or red keylight (right panels) in each condition of Experiment 2. Error bars (±1 standard error) are plotted at representative data points, first at time bin 0, and then in each time bin increasing in log2 units. The contingent event pulses are shifted to the right of the response pulses by .5 s on the x-axis in order to aid comparison. The preference (behavior) pulses in this figure are reprinted from Figure 6.

References

    1. Baum W.M. On two types of deviation from the matching law: Bias and undermatching. Journal of the Experimental Analysis of Behavior. 1974;22:231–242. - PMC - PubMed
    1. Baum W.M. Matching, undermatching, and overmatching in studies of choice. Journal of the Experimental Analysis of Behavior. 1979;32:269–281. - PMC - PubMed
    1. Boutros N, Davison M, Elliffe D. Conditional reinforcers and informative stimuli in a constant environment. Journal of the Experimental Analysis of Behavior. 2009;91:41–60. - PMC - PubMed
    1. Boutros N, Elliffe D, Davison M. Time versus response indices affect conclusions about preference pulses. Behavioural Processes. 2010;84:450–454. - PubMed
    1. Brown P.L, Jenkins H.M. Autoshaping of the pigeon's key-peck. Journal of the Experimental Analysis of Behavior. 1968;11:1–8. - PMC - PubMed

LinkOut - more resources