. 2011 Jun;289(8):943-953.
doi: 10.1007/s00396-011-2421-0. Epub 2011 Apr 2.

Morphology and photoluminescence study of titania nanoparticles

Morphology and photoluminescence study of titania nanoparticles

Mine Memesa et al. Colloid Polym Sci. 2011 Jun.

Abstract

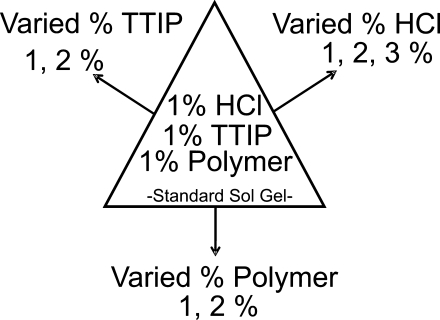
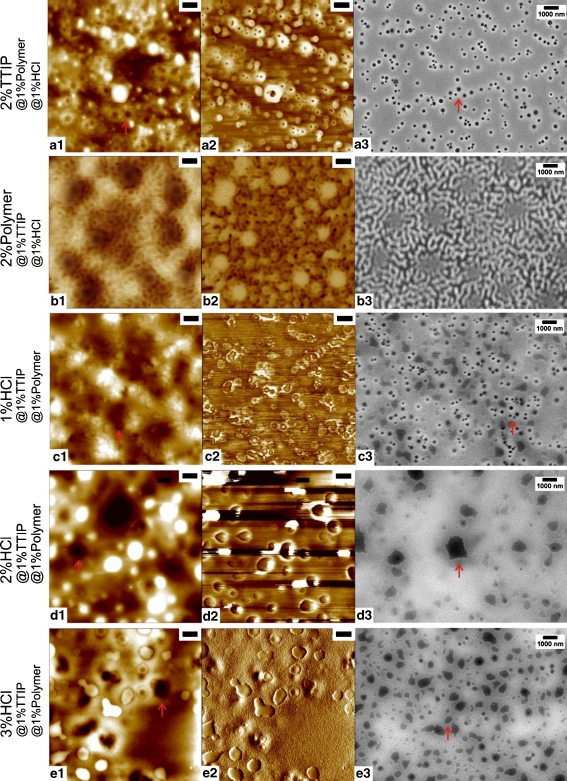
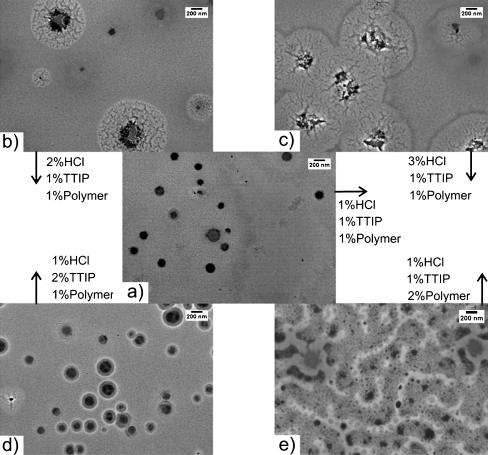
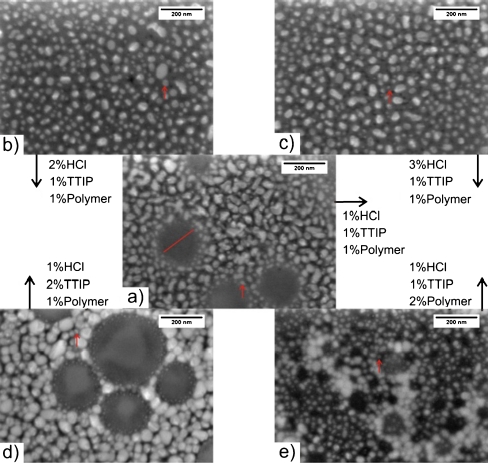
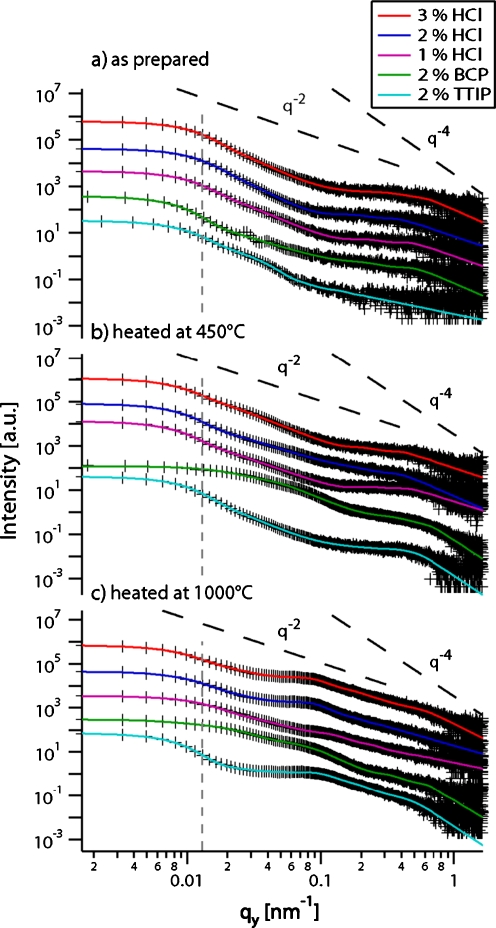
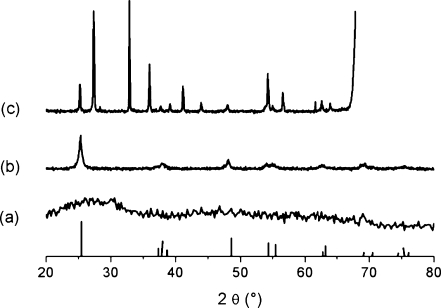
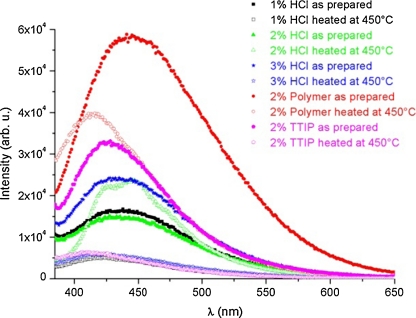
Titania nanoparticles are prepared by sol-gel chemistry with a poly(ethylene oxide) methyl ether methacrylate-block-poly(dimethylsiloxane)-block-poly(ethylene oxide) methyl ether methacrylate triblock copolymer acting as the templating agent. The sol-gel components-hydrochloric acid, titanium tetraisopropoxide, and triblock copolymer-are varied to investigate their effect on the resulting titania morphology. An increased titania precursor or polymer content yields smaller primary titania structures. Microbeam grazing incidence small-angle X-ray scattering measurements, which are analyzed with a unified fit model, reveal information about the titania structure sizes. These small structures could not be observed via the used microscopy techniques. The interplay among the sol-gel components via our triblock copolymer results in different sized titania nanoparticles with higher packing densities. Smaller sized titania particles, (∼13-20 nm in diameter) in the range of exciton diffusion length, are formed by 2% by weight polymer and show good crystallinity with less surface defects and high oxygen vacancies.


Figures

Scheme 1
Scheme 1
Variation of the sol–gel components
Fig. 1
Fig. 1
SFM height (1), phase (2), and SEM (3) images of as-prepared samples: 2% TTIP (a), 2% polymer (b), 1% HCl (c), 2% HCl (d), and 3% HCl (e). Height scales are 60 nm (a1), 50 nm (b1), 30 nm (c1), 50 nm (d1), 40 nm (e1) with phase scales 40° (a2), 20° (b2), 3° (c2), 8° (d2), and 7° (e2). Scale bars correspond to 1 μm
Fig. 2
Fig. 2
SEM images of plasma-treated and annealed at 450 °C samples, 1% HCl (a), 2% HCl (b), 1% HCl (c), 2% TTIP (d), and 2% polymer (e). Scale bars correspond to 200 nm
Fig. 3
Fig. 3
SEM images of plasma treated and annealed at 1,000 °C samples for 1% HCl (a), 2%HCl (b), 3%HCl (c), 2% TTIP (d), and 2% polymer composition (e). Scale bars correspond to 200 nm. Arrows point the representative primary titania structures (L1) in all images, and the cluster size (L2) is depicted with a line in (a)
Fig. 4
Fig. 4
Double-logarithmic plots of the out-of-plane cuts of the 2D intensity as a function of the q y component of the scattering vector. For clarity, the curves are shifted along the intensity axis. The dashed line indicates the resolution limit of the μGISAXS experiment. Colored lines are the fits, from unified fit model, for determining the prominent in-plane length scales, corresponding to the scattering data in black below them. From bottom to top, the curves correspond to samples from 2% TTIP (cyan), 2% BCP (polymer, green), 1% HCl (purple), 2% HCl (blue), and 3%HCl (red) concentration compositions in each graph. Upper graph (a) is for as-prepared, middle (b) is for heated at 450 °C, bottom graph (c) is for heated at 1,000 °C samples
Fig. 5
Fig. 5
XRD diffractograms of as-prepared (a), heated at 450 °C (b), and heated at 1,000 °C (c) 1%HCl samples (standard sol–gel). Typical anatase titania peaks [6] are shown at the bottom
Fig. 6
Fig. 6
Photoluminescence spectra of as-prepared (solid points) and heated at 450 °C (open points) samples

References

    1. Suisalu A, Aarik J, Mandar H, Sildos I. Spectroscopic study of nanocrystalline TiO2 thin films grown by atomic layer deposition. Thin Solid Films. 1998;336(1–2):295–298. doi: 10.1016/S0040-6090(98)01314-5. - DOI
    1. Gratzel M. Photoelectrochemical cells. Nature. 2001;414(6861):338–344. doi: 10.1038/35104607. - DOI - PubMed
    1. Wang ZS, Kawauchi H, Kashima T, Arakawa H. Significant influence of TiO2 photoelectrode morphology on the energy conversion efficiency of N719 dye-sensitized solar cell. Coordin Chem Rev. 2004;248(13–14):1381–1389. doi: 10.1016/j.ccr.2004.03.006. - DOI
    1. Roberson LB, Poggi MA, Kowalik J, Smestad GP, Bottomley LA, Tolbert LM. Correlation of morphology and device performance in inorganic–organic TiO2–polythiophene hybrid solid-state solar cells. Coordin Chem Rev. 2004;248(13–14):1491–1499. doi: 10.1016/j.ccr.2004.02.013. - DOI
    1. Yan MC, Chen F, Zhang JL, Anpo M. Preparation of controllable crystalline titania and study on the photocatalytic properties. J Phys Chem B. 2005;109(18):8673–8678. doi: 10.1021/jp046087i. - DOI - PubMed

LinkOut - more resources