

IL-33 induces IL-9 production in human CD4+ T cells and basophils
- PMID: 21765905
- PMCID: PMC3130774
- DOI: 10.1371/journal.pone.0021695
IL-33 induces IL-9 production in human CD4+ T cells and basophils
Abstract
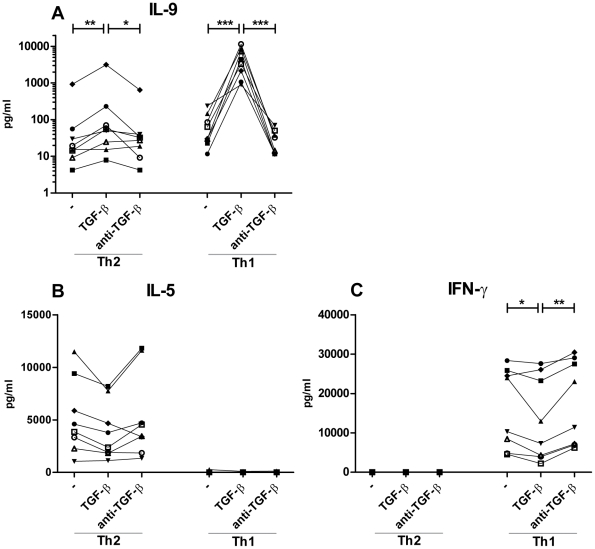
IL-33, an IL-1 family member and ligand for the IL-1 receptor-related protein ST2, has been associated with induction of Th2 cytokines such as IL-4, IL-5, and IL-13. Here, we report that IL-33 can initiate IL-9 protein secretion in vitro in human CD4+ T cells and basophils isolated from peripheral blood. TGF-β has been described as a critical factor for IL-9 induction in Th2 cells; however, we found that TGF-β also induces co-production of IL-9 in purified, naïve (>99%) CD4(+)CD45RA(+)CD45RO(-)CD25(-) T cells differentiated towards a Th1 profile. Subsequently, it was demonstrated that TGF-β is important, although not an absolute requirement, for IL-9 production in CD4+ T cells. IL-9 production by purified (>95%) human basophils, cultured for 24 h with IL-3 or IL-33, was found, with a strong synergy between the two, likely to be explained by the IL-3 upregulated ST2 expression. Collectively, these data indicate that barrier functioning cells are important for the regulation of IL-9 production by immune cells in inflamed tissue.
Conflict of interest statement
Figures


Similar articles
-
IL-33 amplifies both Th1- and Th2-type responses through its activity on human basophils, allergen-reactive Th2 cells, iNKT and NK cells.Int Immunol. 2008 Aug;20(8):1019-30. doi: 10.1093/intimm/dxn060. Epub 2008 Jun 11. Int Immunol. 2008. PMID: 18550585
-
Regulation of human Th9 differentiation by type I interferons and IL-21.Immunol Cell Biol. 2010 Aug;88(6):624-31. doi: 10.1038/icb.2010.53. Epub 2010 Apr 27. Immunol Cell Biol. 2010. PMID: 20421880 Free PMC article.
-
Factors involved in the differentiation of TGF-beta-producing cells from naive CD4+ T cells: IL-4 and IFN-gamma have opposing effects, while TGF-beta positively regulates its own production.J Immunol. 1998 Jun 15;160(12):5719-28. J Immunol. 1998. PMID: 9637480
-
An IL-1 cytokine member, IL-33, induces human basophil activation via its ST2 receptor.J Immunol. 2008 Nov 1;181(9):5981-9. doi: 10.4049/jimmunol.181.9.5981. J Immunol. 2008. PMID: 18941187
-
Human basophils and eosinophils are the direct target leukocytes of the novel IL-1 family member IL-33.Blood. 2009 Feb 12;113(7):1526-34. doi: 10.1182/blood-2008-05-157818. Epub 2008 Oct 27. Blood. 2009. PMID: 18955562 Free PMC article.
Cited by
-
The development and in vivo function of T helper 9 cells.Nat Rev Immunol. 2015 May;15(5):295-307. doi: 10.1038/nri3824. Epub 2015 Apr 7. Nat Rev Immunol. 2015. PMID: 25848755 Free PMC article. Review.
-
Sounding the alarmins-The role of alarmin cytokines in asthma.Allergy. 2023 Feb;78(2):402-417. doi: 10.1111/all.15609. Epub 2022 Dec 14. Allergy. 2023. PMID: 36463491 Free PMC article. Review.
-
Changes in the Th9 cell population and related cytokines in the peripheral blood of infants with recurrent wheezing.Cent Eur J Immunol. 2020;45(1):60-68. doi: 10.5114/ceji.2020.94683. Cent Eur J Immunol. 2020. PMID: 32425681 Free PMC article.
-
Comparative Analyses of the Conformational Dynamics Between the Soluble and Membrane-Bound Cytokine Receptors.Sci Rep. 2020 May 4;10(1):7399. doi: 10.1038/s41598-020-64034-z. Sci Rep. 2020. PMID: 32366846 Free PMC article.
-
Dual Immune Regulatory Roles of Interleukin-33 in Pathological Conditions.Cells. 2022 Oct 14;11(20):3237. doi: 10.3390/cells11203237. Cells. 2022. PMID: 36291105 Free PMC article. Review.
References
-
- Liew FY, Pitman NI, McInnes IB. Disease-associated functions of IL-33: the new kid in the IL-1 family. Nature Reviews Immunology. 2010;10:103–110. DOI 10.1038/nri2692. - PubMed
-
- Allakhverdi Z, Smith DE, Comeau MR, Delespesse G. Cutting edge: The ST2 ligand IL-33 potently activates and drives maturation of human mast cells. J Immunol. 2007;179:2051–2054. 179/4/2051 [pii] - PubMed
Publication types
MeSH terms
Substances
LinkOut - more resources
Full Text Sources
Other Literature Sources
Research Materials
