

Sunlight-exposed biofilm microbial communities are naturally resistant to chernobyl ionizing-radiation levels
- PMID: 21765911
- PMCID: PMC3135598
- DOI: 10.1371/journal.pone.0021764
Sunlight-exposed biofilm microbial communities are naturally resistant to chernobyl ionizing-radiation levels
Abstract
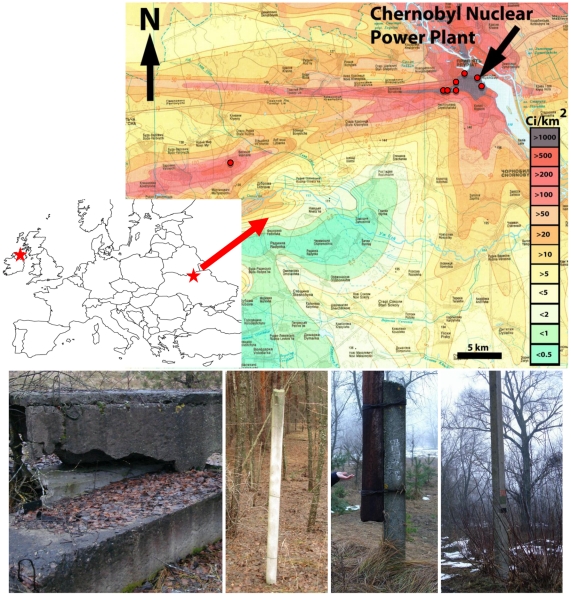
Background: The Chernobyl accident represents a long-term experiment on the effects of exposure to ionizing radiation at the ecosystem level. Though studies of these effects on plants and animals are abundant, the study of how Chernobyl radiation levels affect prokaryotic and eukaryotic microbial communities is practically non-existent, except for a few reports on human pathogens or soil microorganisms. Environments enduring extreme desiccation and UV radiation, such as sunlight exposed biofilms could in principle select for organisms highly resistant to ionizing radiation as well.
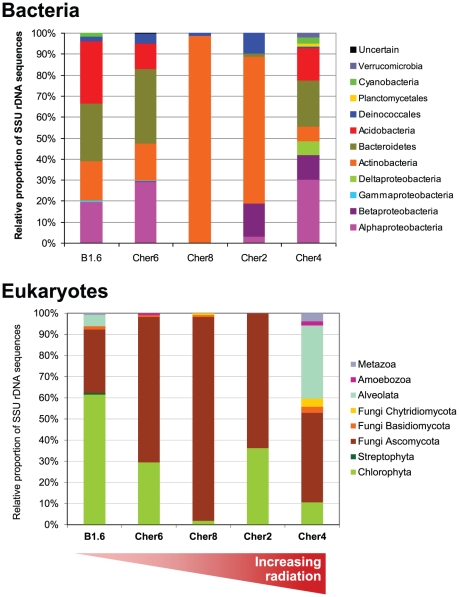
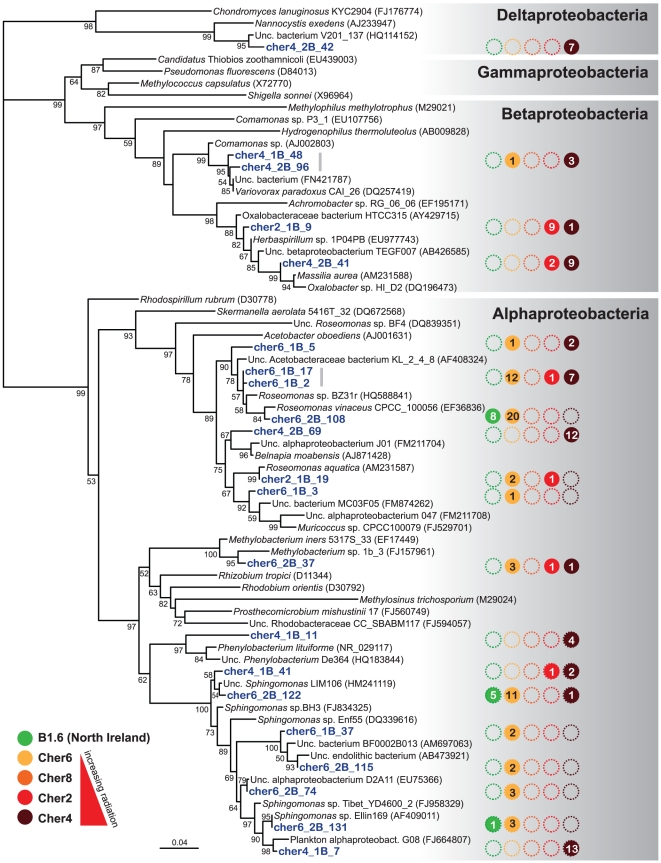
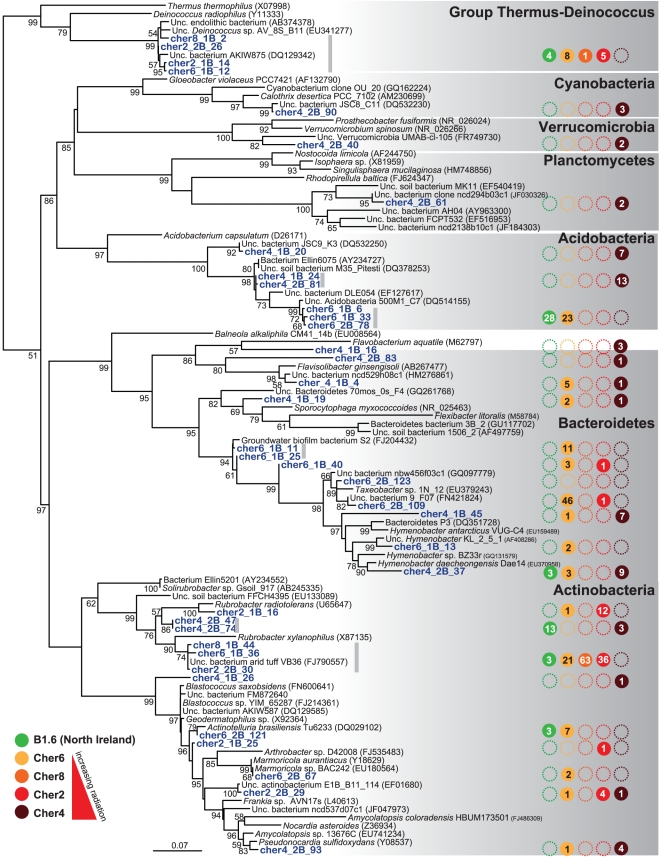
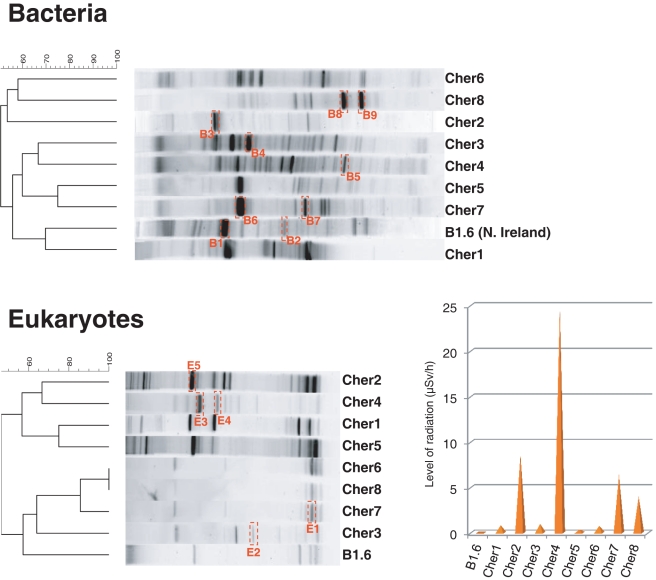
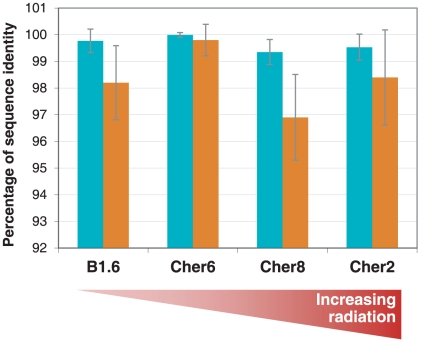
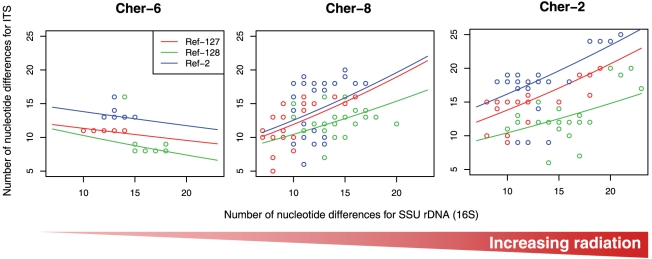
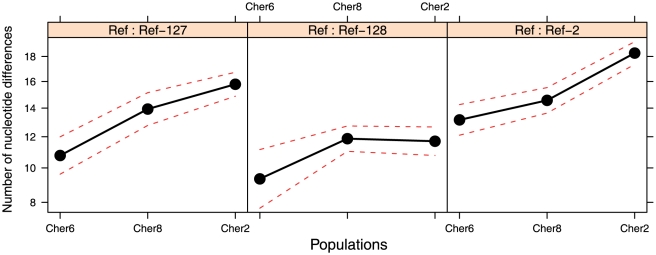
Methodology/principal findings: To test this hypothesis, we explored the diversity of microorganisms belonging to the three domains of life by cultivation-independent approaches in biofilms developing on concrete walls or pillars in the Chernobyl area exposed to different levels of radiation, and we compared them with a similar biofilm from a non-irradiated site in Northern Ireland. Actinobacteria, Alphaproteobacteria, Bacteroidetes, Acidobacteria and Deinococcales were the most consistently detected bacterial groups, whereas green algae (Chlorophyta) and ascomycete fungi (Ascomycota) dominated within the eukaryotes. Close relatives to the most radio-resistant organisms known, including Rubrobacter species, Deinococcales and melanized ascomycete fungi were always detected. The diversity of bacteria and eukaryotes found in the most highly irradiated samples was comparable to that of less irradiated Chernobyl sites and Northern Ireland. However, the study of mutation frequencies in non-coding ITS regions versus SSU rRNA genes in members of a same actinobacterial operational taxonomic unit (OTU) present in Chernobyl samples and Northern Ireland showed a positive correlation between increased radiation and mutation rates.
Conclusions/significance: Our results show that biofilm microbial communities in the most irradiated samples are comparable to non-irradiated samples in terms of general diversity patterns, despite increased mutation levels at the single-OTU level. Therefore, biofilm communities growing in sunlight exposed substrates are capable of coping with increased mutation rates and appear pre-adapted to levels of ionizing radiation in Chernobyl due to their natural adaptation to periodical desiccation and ambient UV radiation.
Conflict of interest statement
Figures

References
-
- Moller AP, Mousseau TA. Biological consequences of Chernobyl: 20 years on. Trends Ecol Evol. 2006;21:200–207. - PubMed
-
- Geras'kin SA, Fesenko SV, Alexakhin RM. Effects of non-human species irradiation after the Chernobyl NPP accident. Environ Int. 2008;34:880–897. - PubMed
-
- Yablokov AV. 9. Chernobyl's radioactive impact on flora. Ann N Y Acad Sci. 2009;1181:237–254. - PubMed
-
- Zhdanova NN, Redchits TI, Zheltonozhsky VA, Sadovnikov LV, Gerzabek MH, et al. Accumulation of radionuclides from radioactive substrata by some micromycetes. J Environ Radioact. 2003;67:119–130. - PubMed
-
- Dighton J, Tugay T, Zhdanova N. Fungi and ionizing radiation from radionuclides. FEMS Microbiol Lett. 2008;281:109–120. - PubMed
Publication types
MeSH terms
Substances
Associated data
- Actions
- Actions
- Actions
- Actions
- Actions
- Actions
- Actions
- Actions
- Actions
- Actions
- Actions
- Actions
- Actions
- Actions
- Actions
- Actions
- Actions
- Actions
- Actions
- Actions
- Actions
- Actions
- Actions
- Actions
- Actions
- Actions
- Actions
- Actions
- Actions
- Actions
- Actions
- Actions
- Actions
- Actions
- Actions
- Actions
- Actions
- Actions
- Actions
- Actions
- Actions
- Actions
- Actions
- Actions
- Actions
- Actions
- Actions
- Actions
- Actions
- Actions
- Actions
- Actions
- Actions
- Actions
- Actions
- Actions
- Actions
- Actions
- Actions
- Actions
- Actions
- Actions
- Actions
- Actions
- Actions
- Actions
- Actions
- Actions
- Actions
- Actions
- Actions
- Actions
- Actions
- Actions
- Actions
- Actions
- Actions
LinkOut - more resources
Full Text Sources
Medical
Molecular Biology Databases
