Comparative Study
. 2012 Feb 15;118(4):1145-54.
doi: 10.1002/cncr.26349. Epub 2011 Jul 15.

Nanotextured substrates with immobilized aptamers for cancer cell isolation and cytology

Affiliations
Comparative Study

Nanotextured substrates with immobilized aptamers for cancer cell isolation and cytology

Yuan Wan et al. Cancer. .

Abstract

Background: The detection of a small number of circulating tumor cells (CTCs) is important, especially in the early stages of cancer. Small numbers of CTCs are hard to detect, because very few approaches are sensitive enough to differentiate these from the pool of other cells. Improving the affinity of a selective, surface-functionalized molecule is important given the scarcity of CTCs in vivo. There are several proteins and aptamers that provide such high affinity; however, using surface nanotexturing increases this affinity even further.

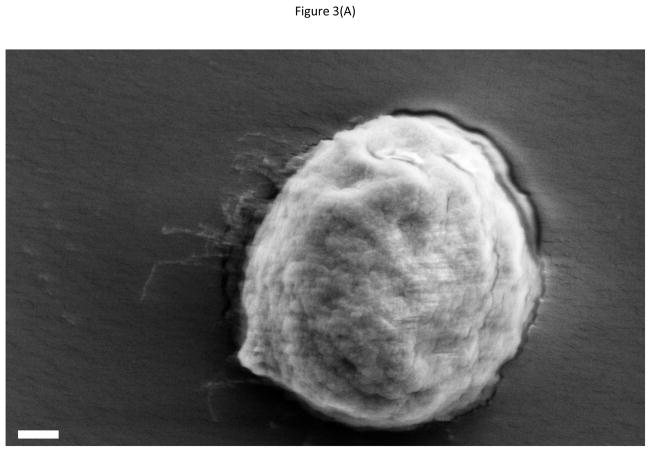
Methods: The authors report an approach to improve the affinity of tumor cell capture by using novel aptamers against cell membrane overexpressed epidermal growth factor receptors (EGFRs) on a nanotextured polydimethylsiloxane (PDMS) substrate. Surface-immobilized aptamers were used to specifically capture tumor cells from physiologic samples.

Results: The nanotexturing of PDMS increased surface roughness at the nanoscale. This increased the effective surface area and resulted in a significantly higher degree of surface functionalization. The phenomenon resulted in increased density of immobilized EGFR-specific RNA aptamer molecules and provided significantly higher efficiency to capture cancer cells from a mixture. The data indicated that CTCs could be captured and enriched, leading to higher yield yet higher background.

Conclusions: A comparison between glass slides, plain PDMS, and nanotextured PDMS functionalized with aptamers demonstrated that a 2-fold approach of using aptamers on nanotextured PDMS can be important for cancer cytology devices, and especially for the idea of a "lab-on-chip," toward higher yield in capture efficiency.


Figures

Figure 1
Figure 1
The surface roughness of PLGA and PDMS cast on PLGA increased after NaOH etching. The AFM micrographs (3 × 3 μm2) of (A) untreated PLGA; (B) PLGA after 10 N NaOH etch for 1 hour. The surface roughness increased from 22 nm on untreated PLGA to 310 nm on nano-textured PLGA surface. The AFM micrographs (8 × 8 μm2) of (C) Nano-textured PDMS surface (roughness: 347 nm); and (D) Nano-textured PDMS after APTES and thiophosgene modification (roughness: 289 nm). Inset to (D) shows SEM micrograph of NaOH treated PLGA surface. The scale bar is 100 μm.
Figure 1
Figure 1
The surface roughness of PLGA and PDMS cast on PLGA increased after NaOH etching. The AFM micrographs (3 × 3 μm2) of (A) untreated PLGA; (B) PLGA after 10 N NaOH etch for 1 hour. The surface roughness increased from 22 nm on untreated PLGA to 310 nm on nano-textured PLGA surface. The AFM micrographs (8 × 8 μm2) of (C) Nano-textured PDMS surface (roughness: 347 nm); and (D) Nano-textured PDMS after APTES and thiophosgene modification (roughness: 289 nm). Inset to (D) shows SEM micrograph of NaOH treated PLGA surface. The scale bar is 100 μm.
Figure 2
Figure 2
The hGBM cells on the anti-EGFR and mutant aptamer modified glass, PDMS and nano-textured PDMS substrates. Substrates were incubated with hGBM and washed with PBS. The hGBM cell densities (number of cells per mm2) on the anti-EGFR aptamer modified (A) glass, (C) PDMS and (E) nano-textured PDMS substrates are 79.3 (S.D.: 11.5), 37.4 (S.D.: 10.1), and 149.6 (S.D.: 12.2) respectively; the cell densities on the mutant aptamer modified (B) glass, (D) PDMS and (F) nano-textured PDMS substrates are 2.2 (S.D.: 1.2), 0.6 (S.D.: 0.8), and 25.6 (S.D.: 6.2) respectively; (*P<0.05). (G) Plot shows average hGBM cell density on each type of substrate. The table in the inset depicts actual numbers used in the plot. The scale bar is same for all images and it shows 100 μm.
Figure 2
Figure 2
The hGBM cells on the anti-EGFR and mutant aptamer modified glass, PDMS and nano-textured PDMS substrates. Substrates were incubated with hGBM and washed with PBS. The hGBM cell densities (number of cells per mm2) on the anti-EGFR aptamer modified (A) glass, (C) PDMS and (E) nano-textured PDMS substrates are 79.3 (S.D.: 11.5), 37.4 (S.D.: 10.1), and 149.6 (S.D.: 12.2) respectively; the cell densities on the mutant aptamer modified (B) glass, (D) PDMS and (F) nano-textured PDMS substrates are 2.2 (S.D.: 1.2), 0.6 (S.D.: 0.8), and 25.6 (S.D.: 6.2) respectively; (*P<0.05). (G) Plot shows average hGBM cell density on each type of substrate. The table in the inset depicts actual numbers used in the plot. The scale bar is same for all images and it shows 100 μm.
Figure 3
Figure 3
SEM micrographs of captured tumor cells on (A) PDMS, (B) nano-textured PDMS, and (C) glass substrate. Micrographs show that cells firmly attach on the rough surface which mimic the basement membrane structure. The scale bar in (A)is 1 μm and it is same for all figures. Cells were fixed in 4% paraformaldehyde for 3 h, and then the substrates were immersed into 20%, 30%, 50%, 70%, 85%, 95% and 100% (v/v) ethanol concentration gradient solution (15 min in each solution). All substrates were lyophilized overnight.
Figure 3
Figure 3
SEM micrographs of captured tumor cells on (A) PDMS, (B) nano-textured PDMS, and (C) glass substrate. Micrographs show that cells firmly attach on the rough surface which mimic the basement membrane structure. The scale bar in (A)is 1 μm and it is same for all figures. Cells were fixed in 4% paraformaldehyde for 3 h, and then the substrates were immersed into 20%, 30%, 50%, 70%, 85%, 95% and 100% (v/v) ethanol concentration gradient solution (15 min in each solution). All substrates were lyophilized overnight.
Figure 4
Figure 4
The hGBM and fibroblast cells on the nano-textured PDMS substrates. Substrates were incubated with a mixture of hGBM and fibroblast and washed with PBS. (A) and (B) are DIC and fluorescent images respectively from the same position on the substrate. The circles in (A) indicate a few fibroblasts that were captured and cannot be seen in (B). The scale bar is 100 μm.
Figure 4
Figure 4
The hGBM and fibroblast cells on the nano-textured PDMS substrates. Substrates were incubated with a mixture of hGBM and fibroblast and washed with PBS. (A) and (B) are DIC and fluorescent images respectively from the same position on the substrate. The circles in (A) indicate a few fibroblasts that were captured and cannot be seen in (B). The scale bar is 100 μm.

References

    1. Curry SJ, et al. In: Fulfilling the potential of cancer prevention and early detection. Council NR, editor. Washington, DC: The National Academies Press; 2003. - PubMed
    1. Smith RA, et al. American Cancer Society guidelines for the early detection of cancer, 2006. CA: A Cancer Journal for Clinicians. 2006;56(1):11. - PubMed
    1. Swennenhuis JF, et al. Characterization of circulating tumor cells by fluorescence in situ hybridization. Cytometry Part A. 2009;75A(6):520–527. - PubMed
    1. Dharmasiri U, et al. Microsystems for the Capture of Low-Abundance Cells. Annual Review of Analytical Chemistry. 2010;3(1):409–431. - PubMed
    1. Tan S, et al. Microdevice for the isolation and enumeration of cancer cells from blood. Biomedical Microdevices. 2009;11(4):883–892. - PubMed

Publication types

MeSH terms