. 2011 Jul 20;101(2):L11-3.
doi: 10.1016/j.bpj.2011.06.021.

Single-voxel recording of voltage transients in dendritic spines

Single-voxel recording of voltage transients in dendritic spines

Corey D Acker et al. Biophys J. .

Abstract

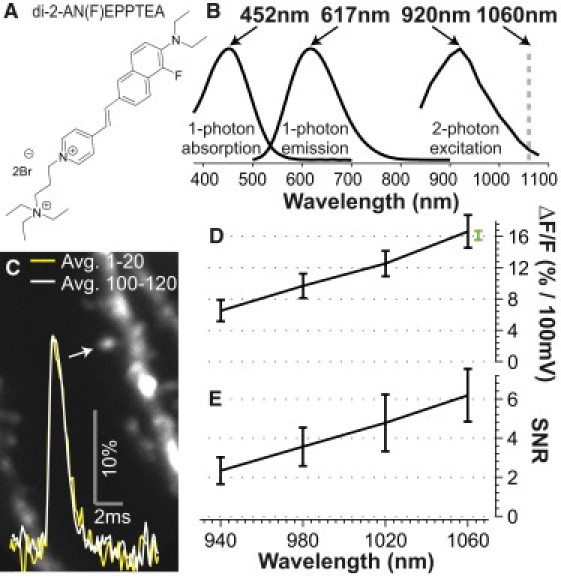
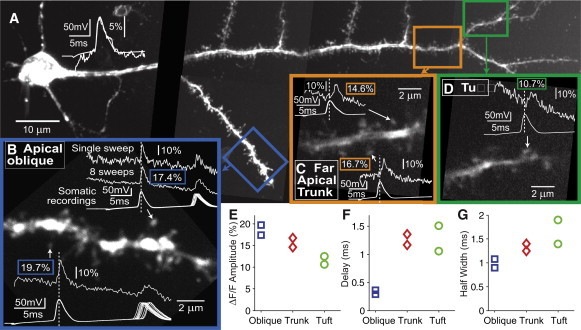
We report sensitive recording of membrane potential in single dendritic spines in cortical neurons within a brain slice using two-photon excitation and a new, fluorinated, intracellularly loaded organic dye, di-2-AN(F)EPPTEA. With a two-photon excitation wavelength of 1060 nm, we achieve voltage sensitivity of >16% change in fluorescence per 100 mV. By targeting single spines in single-voxel recordings, we attain excellent single/noise quality, with back-propagating action potentials (bAPs) visible in single sweeps while recording at 10 kHz. This recording rate allows us to reliably assess fast bAP dynamics on single sweeps including bAP rise times of 0.5 ms. The amplitude and propagation delays of the bAPs are similar among different spines located within the same dendritic region, and this is true despite large differences in spine size. The interregion differences in bAP waveforms in spines vary in relation to their distance from the soma and the caliber of their parent dendrites.


Figures

Figure 1
Figure 1
Stability, voltage-sensitivity of di-2-AN(F)EPPTEA. (A) Chemical structure of the dye. (B) One-photon absorption and emission spectra in multilamellar lipid vesicles with peak wavelengths shown. Two-photon excitation spectrum measured in a brain slice—excitation power (after objective) was 2.5 mW for all wavelengths. (C) Overlapped averages of first and last 20 (of 120) recordings of back-propagating action potentials (bAPs) in a single spine, with no change in signal. (D) Two-photon voltage sensitivity as a function of excitation wavelength, measured using bAP amplitudes at proximal spines, normalized by somatic AP amplitude (100 mV somatic). For each of N = 9 spines (five cells), all four wavelengths were tested (error bars are SD). Separate green point: all proximal spine measurements at 1060 nm (16.1%, N = 15 spines, seven cells, error bar is mean ± SE). (E) Single-sweep signal/noise ratios (SNRs). SNR values were normalized by √N (number of sweeps averaged). Typical laser powers: 1 mW at 940 nm, 4 mW at 1060 nm. Bleaching is negligible in all instances.
Figure 2
Figure 2
Imaging of action potential backpropagation and invasion of dendritic spines using voltage-sensitive dye (VSD) di-2-AN(F)EPPTEA. (A) An image montage of a cortical pyramidal neuron loaded via somatic patch pipette with the VSD. The traces at the upper left show superimposed somatic electrical and perisomatic VSD records, both at 10 kHz, demonstrating precise temporal synchronization. (B) Recordings of back-propagating action potentials (bAPs, two spikes, analysis applies to first spike only), elicited using somatic current injection, at two different spines in the same region on an apical oblique dendrite. Somatic electrical waveforms with multiple recordings aligned at the first spike are shown below single-voxel imaging data from spines. (Inset boxes) Amplitudes of the optically recorded bAP waveforms. For the top spine, a single optical sweep is shown along with the average of eight temporally aligned sweeps. Single-sweep measurements: 18.0% amplitude, 0.29 ms delay, 0.32 ms rise time, 0.83 ms half-width, SNR = 8.3). (C) Same as panel B, except two spines are targeted on a distal apical trunk region. (D) VSD recording from a spine on the apical tuft. (EG) Summary of amplitudes, propagation delay times (optical relative to electrical peak time), and half-widths for bAPs recorded in spines in all three regions. In all cases, spines (indicated by arrows) were placed in focus and targeted at their centers. (Vertical dashed lines) Peak times of somatic action potentials. Laser power (measured after objective, above slice): 4−5.5 mW (proximal to distal locations).

References

    1. Canepari M., Zecevic D., editors. Membrane Potential Imaging in the Nervous System: Methods and Applications. Springer; New York: 2010.
    1. Nuriya M., Jiang J., Yuste R. Imaging membrane potential in dendritic spines. Proc. Natl. Acad. Sci. USA. 2006;103:786–790. - PMC - PubMed
    1. Palmer L.M., Stuart G.J. Membrane potential changes in dendritic spines during action potentials and synaptic input. J. Neurosci. 2009;29:6897–6903. - PMC - PubMed
    1. Holthoff K., Zecevic D., Konnerth A. Rapid time course of action potentials in spines and remote dendrites of mouse visual cortex neurons. J. Physiol. 2010;588:1085–1096. - PMC - PubMed
    1. Fisher J.A.N., Barchi J.R., Salzberg B.M. Two-photon excitation of potentiometric probes enables optical recording of action potentials from mammalian nerve terminals in situ. J. Neurophysiol. 2008;99:1545–1553. - PubMed

Publication types

MeSH terms

Substances

LinkOut - more resources