. 2011 Aug 15;51(16):1861-71.
doi: 10.1016/j.visres.2011.06.016. Epub 2011 Jul 8.

Barrier effects in non-retinotopic feature attribution

Affiliations

Barrier effects in non-retinotopic feature attribution

Murat Aydın et al. Vision Res. .

Abstract

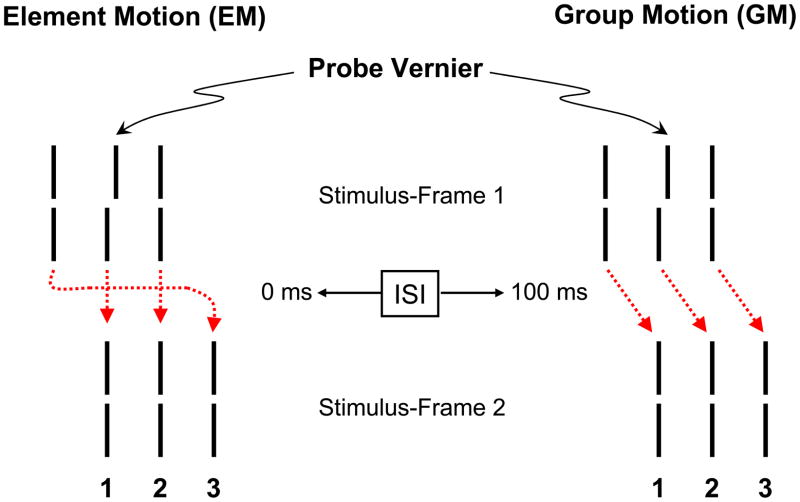
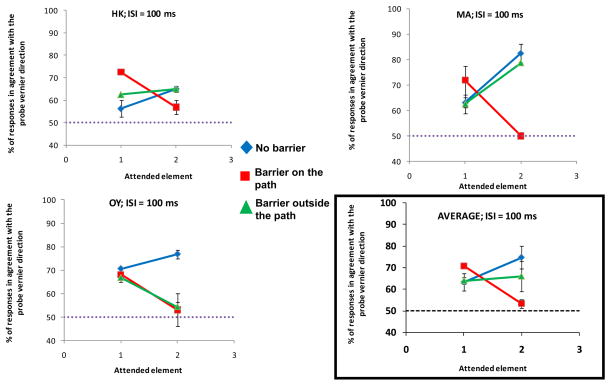
When objects move in the environment, their retinal images can undergo drastic changes and features of different objects can be inter-mixed in the retinal image. Notwithstanding these changes and ambiguities, the visual system is capable of establishing correctly feature-object relationships as well as maintaining individual identities of objects through space and time. Recently, by using a Ternus-Pikler display, we have shown that perceived motion correspondences serve as the medium for non-retinotopic attribution of features to objects. The purpose of the work reported in this manuscript was to assess whether perceived motion correspondences provide a sufficient condition for feature attribution. Our results show that the introduction of a static "barrier" stimulus can interfere with the feature attribution process. Our results also indicate that the barrier stops feature attribution based on interferences related to the feature attribution process itself rather than on mechanisms related to perceived motion.


Figures

Fig. 1
Fig. 1
The Ternus-Pikler display and its use in probing non-retinotopic feature attribution. When ISI is short (left panel) Element Motion (EM) is perceived. The dashed arrows indicate the perceived motion correspondences between the elements in the two frames. The leftmost element appears to move to the rightmost element while the other two elements appear stationary. When ISI is long (right panel), Group Motion (GM) is perceived, i.e. the three lines appear to shift rightwards as a group as depicted by the dashed arrows. A “probe-Vernier” stimulus is inserted to the central element of frame 1 and observers are asked to report the perceived Vernier-offset for one of the three elements, labeled 1, 2, and 3, in the second frame. According to retinotopic feature processing, the Vernier information should be integrated with element 1 of second frame. If feature processing is carried out non-retinotopically according to perceived motion correspondences (dashed arrows), the Vernier information should be integrated with the element labeled 1 in the case of EM and the element labeled 2 in the case of GM.
Fig. 2
Fig. 2
a) The stimulus used in Condition 1. A Vernier offset was inserted into the left element of Frame 1. This stimulus consists of Ternus-Pikler display with the two flanking elements (the leftmost and the rightmost elements in Frames 1 and 2, respectively) deleted. Without the flanking elements, no motion is perceived. b) The Ternus-Pikler stimulus used in Condition 2. A Vernier offset was inserted into the middle element of Frame 1.
Fig. 3
Fig. 3
Stimulus display for Condition 3. The stimulus was identical to the one used in Condition 2 (Fig. 2b) with the exception that a barrier was inserted either halfway between Element 2 and Element 3 of Frame 2 (outside the path of feature attribution; left panel) or halfway between Element 1 and element 2 of Frame 2 (on the path of feature attribution; right panel). The task of the observer was to report the perceived direction of the Vernier-offset (right or left) in Element 1 or Element 2 of Frame 2.
Fig. 4
Fig. 4
Results for Condition 1. The perceived direction of the Vernier offset in Element 1 and Element 2 of Frame 2 (see Fig. 2a) was reported at 0 ms (squares) and 100 ms (circles) ISIs. The dotted horizontal line represents chance level. Error bars represent ±1 SEM (N=4).
Fig. 5
Fig. 5
Results for Conditions 2 (No Barrier, see Fig. 2b) and 3 (Barrier, see Fig. 3) for ISI=0ms for the three subjects along with their average (bottom right panel). The dotted horizontal lines represent chance level. Error bars show ±1 SEM.
Fig. 6
Fig. 6
Results for Conditions 2 (No Barrier, see Fig. 2b) and 3 (Barrier, see Fig. 3) for ISI=100ms for the three subjects along with their average (bottom right panel). The dotted horizontal lines represent chance level. Error bars show ±1 SEM.
Fig. 7
Fig. 7
Stimulus displays for Experiment 2a. Same as in Fig. 3 except that a mask, consisting of a number of line-segments with random orientations, was turned on and off synchronously with the two frames of the Ternus-Pikler display. The stimulus shown in the left (right) panel corresponds to the Barrier on the path (Barrier outside the path) conditions. The barrier was always presented in the center of the screen. Examples in this figure are for rightward motion. Mirror-symmetric versions of these stimuli were used for leftward motion. The task of the observer was to report the direction of motion (left or right) of the Ternus-Pikler display. The ISI was fixed at 100 ms.
Fig. 8
Fig. 8
Results of Experiment 2a. The number of masking lines at convergence for the Barrier on the path and the Barrier outside the path cases along with their baseline No Barrier conditions. Error bars represent ±1 SEM (N=4).
Fig. 9
Fig. 9
Results of Experiment 2b. Percentage of group motion reports as a function of ISI. Smooth curves show the fitted cumulative Gaussian functions. Data averaged over observers. Error bars correspond to ±1 SEM (N=4).
Fig. 10
Fig. 10
Results of Experiment 3. The perceived offset direction in Element 2 of Frame 2 was reported at 100 ms ISI. The barrier was presented halfway between Element 1 and Element 2 of Frame 2 (Fig. 3). The performance is plotted with respect to the luminance of the barrier (the numbers in parentheses indicate the Weber contrast of the barrier). The performance without the barrier and with barrier at 4 cd/m2 (No Barrier and Barrier conditions from Experiment 1) are also shown. Error bars represent ±1 SEM (N=3).
Fig. 11
Fig. 11
The effect of a gap in the barrier. Data from Experiment 1 are also included for comparison (no Barrier and no Gap conditions). Error bars represent ±1 SEM (N=3).
Fig. 12
Fig. 12
Stimulus timing for the experiments where the barrier offset timing was fixed and the barrier onset timing varied. F1 and F2 represent the two frames of the Ternus-Pikler stimulus.
Fig. 13
Fig. 13
Stimulus timing for the experiments where the barrier onset timing was fixed and the barrier offset timing varied. F1 and F2 represent the two frames of the Ternus-Pikler stimulus.
Fig. 14
Fig. 14
The effect of barrier onset asynchrony on feature attribution. The horizontal solid line shows performance without the barrier with dashed horizontal lines corresponding to ±1 SEM (data from Experiment 1). For comparison, barrier onset asynchrony of −600 ms from Experiment 1 is also plotted. Error bars represent ±1 SEM (N=3).
Fig. 15
Fig. 15
The effect of barrier offset asynchrony on feature attribution. The horizontal solid line shows performance without the barrier with dashed horizontal lines corresponding to ±1 SEM (data from Experiment 1). For comparison, barrier offset asynchrony of 840 ms from Experiment 1 is also plotted. Error bars represent ±1 SEM (N=3).
Fig. 16
Fig. 16
Dual organization in perceptual grouping. A. The dual organization consists of (i) vertical groups based on color similarity and (ii) the diagonal organization of the three stars within the red vertical groups, i.e. the star at the top of the leftmost red column, the star at the center of the central red column and the star at the bottom of the rightmost red column forming a diagonal group. B. When color grouping is abolished, the diagonal stars do not appear as a salient group anymore. Thus, the color-based vertical organization is necessary for the formation of the diagonal group of stars. C. Introduction of additional stars can interfere with the diagonal group of stars without affecting the diagonal color-based perceptual organization.

References

    1. Aydin M, Herzog MH, Öğmen H. Attention modulates spatio-temporal grouping. Vision Research. 2011;51:435–446. - PMC - PubMed
    1. Bachmann T. Psychophysiology of visual masking: The fine structure of conscious experience. New York: Nova Science Publishers; 1994.
    1. Boi M, Öğmen H, Krummenacher J, Otto T, Herzog MH. A (fascinating) litmus test for human retino- vs. non-retinotopic processing. Journal of Vision. 2009;9(13):5, 1–11. doi: 10.1167/9.13.5. http://journalofvision.org/9/13/5/ - DOI - PMC - PubMed
    1. Breitmeyer BG, Öğmen H. Recent models and findings in visual backward masking: A comparison, review, and update. Perception & Psychophysics. 2000;62:1572–1595. - PubMed
    1. Breitmeyer BG, Öğmen H. Visual masking: Time slices through conscious and unconscious vision. 2. Oxford, UK: Oxford University Press; 2006.

Publication types