

A linear model for estimation of neurotransmitter response profiles from dynamic PET data
- PMID: 21767654
- PMCID: PMC3702051
- DOI: 10.1016/j.neuroimage.2011.07.002
A linear model for estimation of neurotransmitter response profiles from dynamic PET data
Abstract
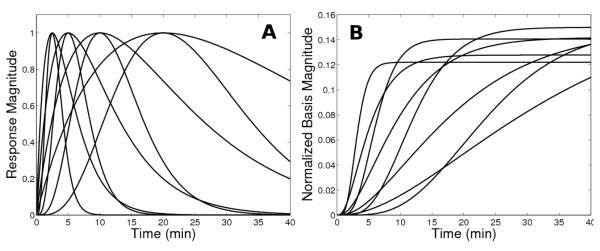
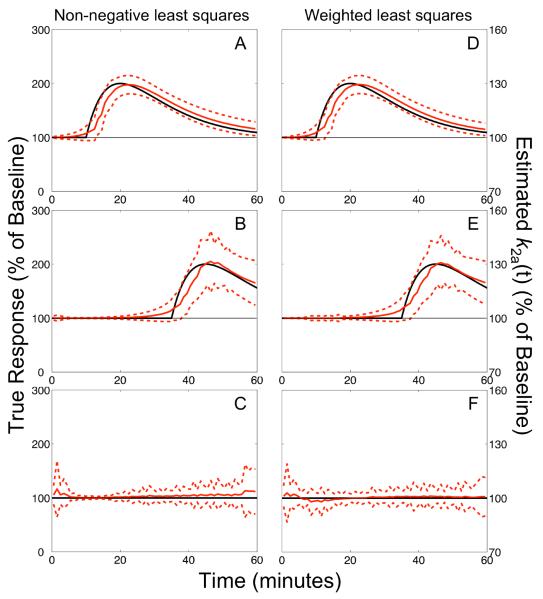
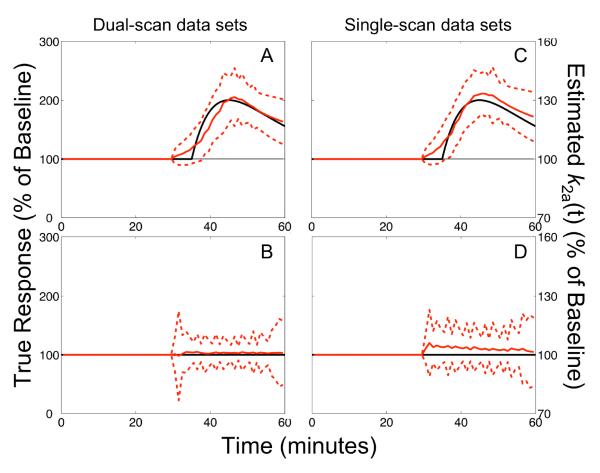
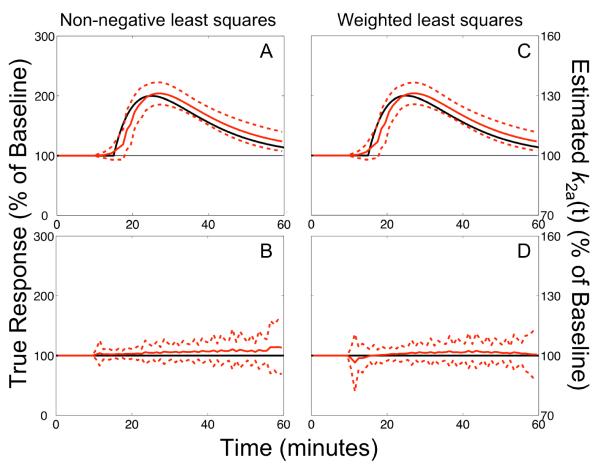
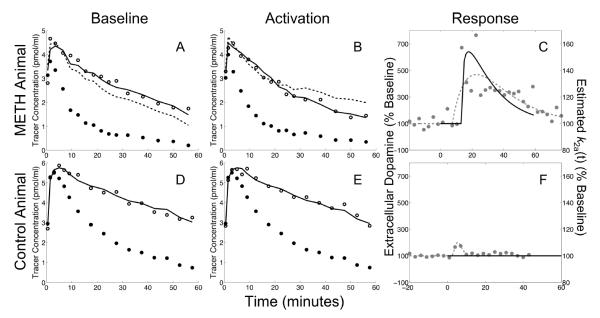
The parametric ntPET model (p-ntPET) estimates the kinetics of neurotransmitter release from dynamic PET data with receptor-ligand radiotracers. Here we introduce a linearization (lp-ntPET) that is computationally efficient and can be applied to single scan data. lp-ntPET employs a non-invasive reference region input function and extends the LSRRM of Alpert et al. (2003) using basis functions to characterize the time course of neurotransmitter activation. In simulation studies, the temporal precision of neurotransmitter profiles estimated by lp-ntPET was similar to that of p-ntPET (standard deviation ~3 min for responses early in the scan) while computation time was reduced by several orders of magnitude. Violations of model assumptions such as activation-induced changes in regional blood flow or specific binding in the reference tissue have negligible effects on lp-ntPET performance. Application of the lp-ntPET method is demonstrated on [11C]raclopride data acquired in rats receiving methamphetamine, which yielded estimated response functions that were in good agreement with simultaneous microdialysis measurements of extracellular dopamine concentration. These results demonstrate that lp-ntPET is a computationally efficient, linear variant of ntPET that can be applied to PET data from single or multiple scan designs to estimate the time course of neurotransmitter activation.
Copyright © 2011 Elsevier Inc. All rights reserved.
Figures
Similar articles
-
Voxelwise lp-ntPET for detecting localized, transient dopamine release of unknown timing: sensitivity analysis and application to cigarette smoking in the PET scanner.Hum Brain Mapp. 2014 Sep;35(9):4876-91. doi: 10.1002/hbm.22519. Epub 2014 Apr 3. Hum Brain Mapp. 2014. PMID: 24700424 Free PMC article.
-
Initial comparison of ntPET with microdialysis measurements of methamphetamine-induced dopamine release in rats: support for estimation of dopamine curves from PET data.Mol Imaging Biol. 2008 Mar-Apr;10(2):67-73. doi: 10.1007/s11307-007-0124-1. Epub 2008 Jan 4. Mol Imaging Biol. 2008. PMID: 18176804
-
Direct Estimation of Voxel-Wise Neurotransmitter Response Maps From Dynamic PET Data.IEEE Trans Med Imaging. 2019 Jun;38(6):1371-1383. doi: 10.1109/TMI.2018.2883756. Epub 2018 Nov 28. IEEE Trans Med Imaging. 2019. PMID: 30507497
-
PET kinetic analysis: wavelet denoising of dynamic PET data with application to parametric imaging.Ann Nucl Med. 2007 Sep;21(7):379-86. doi: 10.1007/s12149-007-0044-9. Epub 2007 Sep 25. Ann Nucl Med. 2007. PMID: 17876550 Review.
-
Modeling PET Data Acquired During Nonsteady Conditions: What If Brain Conditions Change During the Scan?J Nucl Med. 2024 Dec 3;65(12):1824-1837. doi: 10.2967/jnumed.124.267494. J Nucl Med. 2024. PMID: 39448268 Free PMC article. Review.
Cited by
-
Limitations of SRTM, Logan graphical method, and equilibrium analysis for measuring transient dopamine release with [(11)C]raclopride PET.Am J Nucl Med Mol Imaging. 2013 Apr 9;3(3):247-60. Print 2013. Am J Nucl Med Mol Imaging. 2013. PMID: 23638336 Free PMC article.
-
A multi-pronged investigation of option generation using depression, PET and modafinil.Brain. 2022 Jun 3;145(5):1854-1865. doi: 10.1093/brain/awab429. Brain. 2022. PMID: 35150243 Free PMC article. Clinical Trial.
-
Sex differences in the brain's dopamine signature of cigarette smoking.J Neurosci. 2014 Dec 10;34(50):16851-5. doi: 10.1523/JNEUROSCI.3661-14.2014. J Neurosci. 2014. PMID: 25505336 Free PMC article.
-
Toward whole-brain dopamine movies: a critical review of PET imaging of dopamine transmission in the striatum and cortex.Brain Imaging Behav. 2019 Apr;13(2):314-322. doi: 10.1007/s11682-017-9779-7. Brain Imaging Behav. 2019. PMID: 29071465 Free PMC article. Review.
-
Effects of flow changes on radiotracer binding: Simultaneous measurement of neuroreceptor binding and cerebral blood flow modulation.J Cereb Blood Flow Metab. 2019 Jan;39(1):131-146. doi: 10.1177/0271678X17725418. Epub 2017 Aug 17. J Cereb Blood Flow Metab. 2019. PMID: 28816571 Free PMC article.
References
-
- Aalto S, Brück A, Laine M, Någren K, Rinne JO. Frontal and temporal dopamine release during working memory and attention tasks in healthy humans: a positron emission tomography study using the high-affinity dopamine D2 receptor ligand [11C]FLB 457. The Journal of Neuroscience. 2005;25:2471–7. - PMC - PubMed
-
- Abi-Dargham A, Gil R, Krystal J, Baldwin RM, Seibyl JP, Bowers M, Van Dyck CH, Charney DS, Innis RB, Laruelle M. Increased Striatal Dopamine Transmission in Schizophrenia: Confirmation in a Second Cohort. Am. J. Psychiatry. 1998;155:761–767. - PubMed
-
- Akaike H. A New Look at the Statistical Model Identification. IEEE Trans Automatic Control. 1974;19:716–23.
-
- Akaike H. A Bayesian analysis of the minimum AIC procedure. Ann Inst Stat Math. 1978;30:9–14.
-
- Alpert NM, Badgaiyan RD, Livni E, Fischman AJ. A novel method for noninvasive detection of neuromodulatory changes in specific neurotransmitter systems. NeuroImage. 2003;19:1049–60. - PubMed
Publication types
MeSH terms
Substances
Grants and funding
LinkOut - more resources
Full Text Sources
