. 2011 Oct 7;286(40):34872-82.
doi: 10.1074/jbc.M111.246108. Epub 2011 Jul 16.

Structure and mechanism of iron translocation by a Dps protein from Microbacterium arborescens

Affiliations

Structure and mechanism of iron translocation by a Dps protein from Microbacterium arborescens

Jelena Pesek et al. J Biol Chem. .

Abstract

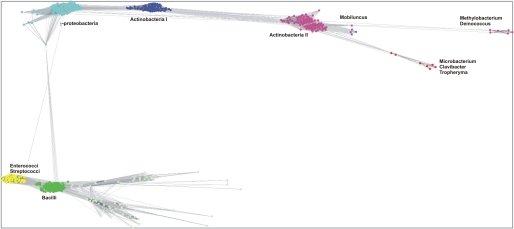
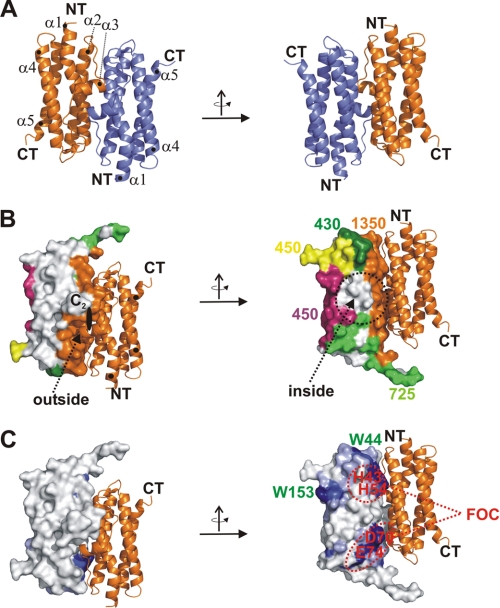
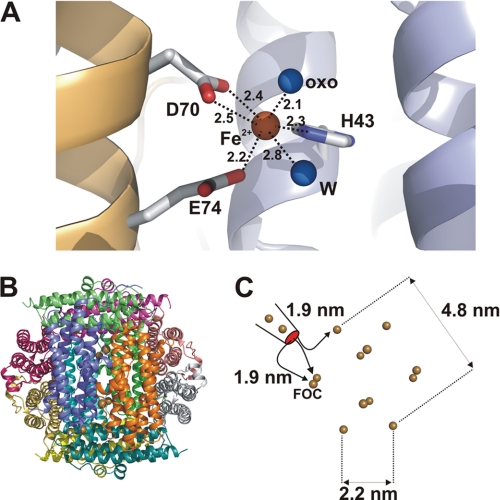
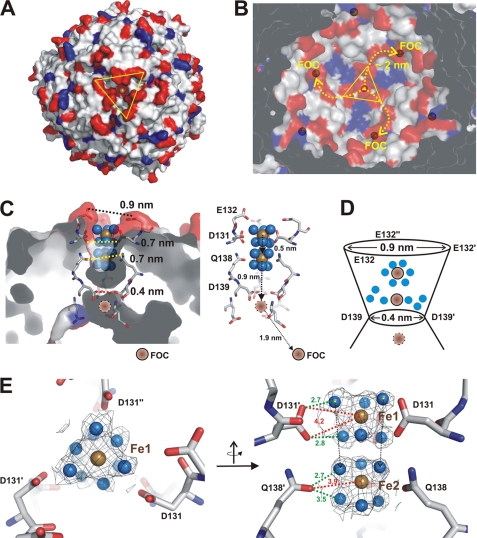
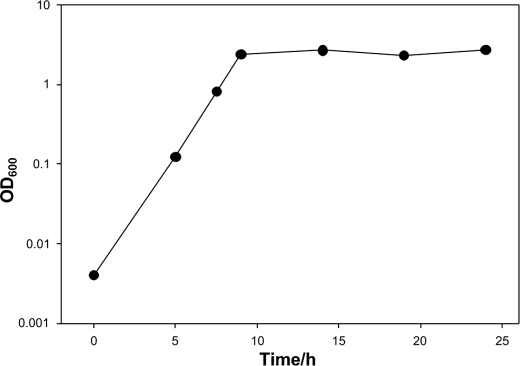
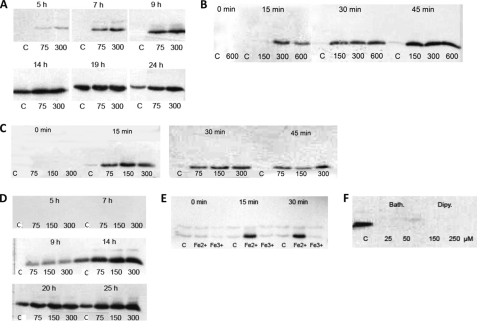
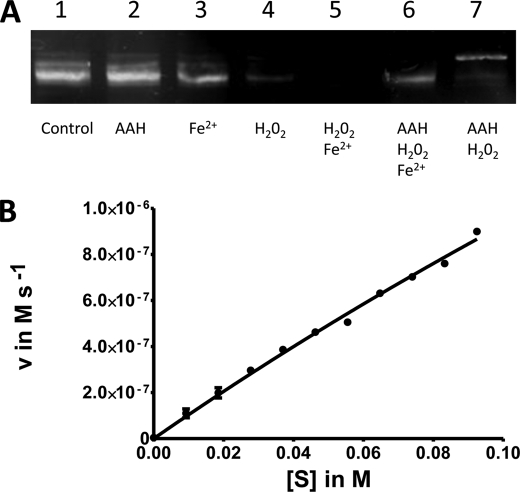
Dps (DNA protection during starvation) enzymes are a major class of dodecameric proteins that bacteria use to detoxify their cytosol through the uptake of reactive iron species. In the stationary growth phase of bacteria, Dps enzymes are primarily used to protect DNA by biocrystallization. To characterize the wild type Dps protein from Microbacterium arborescens that displays additional catalytic functions (amide hydrolysis and synthesis), we determined the crystal structure to a resolution of 2.05 Å at low iron content. The structure shows a single iron at the ferroxidase center coordinated by an oxo atom, one water molecule, and three ligating residues. An iron-enriched protein structure was obtained at 2 Å and shows the stepwise uptake of two hexahydrated iron atoms moving along channels at the 3-fold axis before a restriction site inside the channels requires removal of the hydration sphere. Supporting biochemical data provide insight into the regulation of this acylamino acid hydrolase. Moreover, the peroxidase activity of the protein was determined. The influence of iron and siderophores on the expression of acylamino acid hydrolase was monitored during several stages of cell growth. Altogether our data provide an interesting view of an unusual Dps-like enzyme evolutionarily located apart from the large Dps sequence clusters.


Figures

FIGURE 1.
FIGURE 1.
Sequence cluster map of Dps proteins. Dps-like sequences were obtained by a CS-BLAST search, and sequences were clustered according to their sequence similarities in the program CLANS. Connecting lines representing higher similarity are black, whereas sequences connected by gray lines show lower sequence similarity. Five large clusters were identified comprising Dps molecules from Bacilli, Enterococci/Streptococci, γ-Proteobacteria, Actinobacteria I, and Actinobacteria II. There are three subclusters diverging from Actinobacteria II: Mobiluncus species, Methylobacterium/Deinococcus, and a cluster comprising Microbacterium/Clavibacter/Tropheryma.
FIGURE 2.
FIGURE 2.
Structure of dimeric AAH protein. A, ribbon model of a dimer subunit of AAH from M. arborescence. The two subunits are color-coded in orange and blue. The pictures on the right and left are related by a rotation of the subunit by 180° around the y axis. The protein consists of five helices, which are marked by numbers (α1–α5) as well as termini (N terminus (NT) and C terminus (CT)). B, ribbon model and surface representation of a dimer subunit of AAH shown along a 2-fold axis. One monomer is represented as a ribbon model; the second is represented as a surface representation. The two views represent the inner and outer views of the dimer. The interfaces between the surface-encoded monomer and five adjacent proteins are marked with colors (orange, dark green, light green, yellow, and magenta). Numbers represent the interface between the individual subunits in Å2. C, surface representation of one monomer and the symmetry-related monomer with conserved residues extracted from a multiple alignment of AAH against all Dps-like proteins marked in blue. Two tryptophan residues (Trp-44 and Trp-153) and four residues involved in the FOC formation are marked by red and green numbers.
FIGURE 3.
FIGURE 3.
Structure of FOC and distribution of FOCs in dodecameric complex. A, structure of the FOC with the iron atom in brown and the ligating molecules (water (W) and the oxo atom (oxo)) in blue (bond lengths are given in Å). The iron atom has a pseudohexameric coordination sphere with two residues contributing three bonds (Asp-70 and Glu-74) from one subunit (in brown) and a third residue (His-43) located on the second subunit (marked in blue). B, dodecameric arrangement of AAH with all subunits color-coded by different colors. Small brown dots represent the positions of iron atoms bound in the AAHL structure, all of which are bound at the FOCs. C, schematic representation of the 12 iron atoms localized at FOCs and distances given in nm between these atoms. Distances between the entry of iron into the inner shell and the three nearest neighboring FOCs are marked.
FIGURE 4.
FIGURE 4.
Electrostatic distribution of AAH dodecamer and iron cluster uptake. A, surface representation of the dodecamer with negatively charged residues marked in red and positively charged residues marked in blue. The view is of the channel, which runs along the 3-fold axis and shows a significant surplus of surrounding negative charges. B, view into the dodecameric shell from the opposite side relative to A with the pathway of iron along negative charged residues marked in yellow. In A and B, the 3-fold axis is marked by triangles. C, cross-section of the ion channel running along the 3-fold axis. Residues lining this channel are depicted in stick representation. Two iron-water clusters are shown with iron atoms in brown and water molecules in blue. A third, hypothetical iron binding site is presented in dark brown. Vertical distances between residues lining the channel are given in nm. On the right-hand side, an overview of the channel is presented emphasizing the distances between the individual iron-water clusters, the distances between the hypothetical iron atom within the protein shell, and the distance of 1.9 nm to the closest FOC. D, schematic view of the translocation process. The lateral dimension of the iron-water cluster further along the pore decreases, leading to the removal of water molecules at the entry point of the cluster into the inner protein shell. E, experimental verification of the two iron-water complexes (Fe1 and Fe2). A |2FobsFcalc| electron density in the vicinity of the molecules is shown. Residues involved in binding are represented in stick presentation. On the left-hand side, the view along the 3-fold axis is shown, and on the right-hand side, the view of the clusters from the side perspective is given.
FIGURE 5.
FIGURE 5.
Growth curve and corresponding time points for Western blot analysis of M. arborescens Se14.
FIGURE 6.
FIGURE 6.
Western blot analysis of M. arborescens Se14. The AAH protein was identified with a specific antibody. Samples were taken at distinct time points, the A600 was measured, and the sample was stored for Western blot analysis. The samples were diluted or concentrated to the same A600 before analysis. The control culture (C) was cultivated in BHI medium without supplementation. A, influence of ferrioxamine E (75 and 300 nm) on the expression of AAH over the whole growth curve. B, influence of ferrioxamine E (150–600 nm) on the expression of AAH in the exponential growth phase. Samples were taken 15, 30, and 45 min after treatment. C, influence of FeSO4 (75–300 μm) on the expression of AAH in the exponential growth phase. Samples were taken 15, 30, and 45 min after treatment. D, influence of FeSO4 (75–300 μm) on the expression of AAH over the whole growth curve. E, influence of Fe2+ on the expression of AAH in the exponential growth phase. The culture was treated with FeSO4 or FeCl3 (300 μm), and samples were taken after 15 and 30 min. F, influence of iron chelators on the expression of AAH. M. arborescens was cultivated for 20 h in the presence of bathophenanthroline disulfonic acid (25–50 μm) and 2,2′-dipyridyl (150–250 μm).
FIGURE 7.
FIGURE 7.
Peroxidase activity of AAH. A, protection of DNA in the presence of AAH shown by DNA separation in an agarose gel. pET28a vector DNA was exposed to an excess of iron and hydrogen peroxide. B, nonlinear fit of Michaelis-Menten plot of AAH peroxidase activity assayed by oxidation of ortho-phenylenediamine. One exemplary data set with standard errors is shown.

Similar articles

Cited by

References

    1. Andrews S. C., Robinson A. K., Rodríguez-Quiñones F. (2003) FEMS Microbiol. Rev. 27, 215–237 - PubMed
    1. Hantke K. (2001) Curr. Opin. Microbiol. 4, 172–177 - PubMed
    1. McHugh J. P., Rodríguez-Quinoñes F., Abdul-Tehrani H., Svistunenko D. A., Poole R. K., Cooper C. E., Andrews S. C. (2003) J. Biol. Chem. 278, 29478–29486 - PubMed
    1. Chiancone E., Ceci P. (2010) Front. Biosci. 15, 122–131 - PubMed
    1. Battista J. R. (1997) Annu. Rev. Microbiol. 51, 203–224 - PubMed

Publication types

LinkOut - more resources