. 2011 Sep 9;286(36):31749-60.
doi: 10.1074/jbc.M111.259028. Epub 2011 Jul 15.

Sponge transgenic mouse model reveals important roles for the microRNA-183 (miR-183)/96/182 cluster in postmitotic photoreceptors of the retina

Affiliations

Sponge transgenic mouse model reveals important roles for the microRNA-183 (miR-183)/96/182 cluster in postmitotic photoreceptors of the retina

Qubo Zhu et al. J Biol Chem. .

Abstract

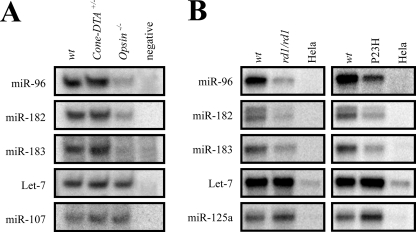
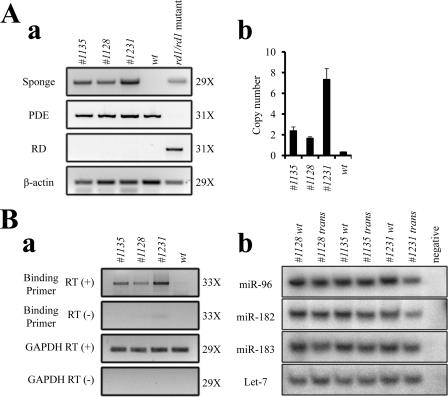
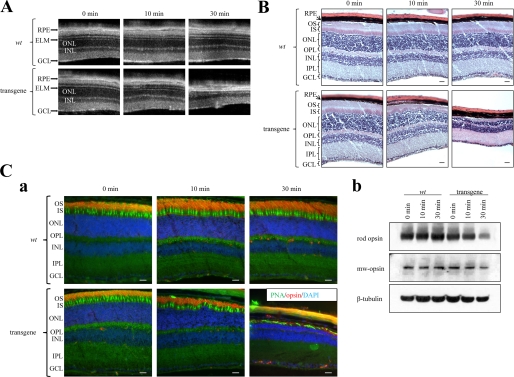
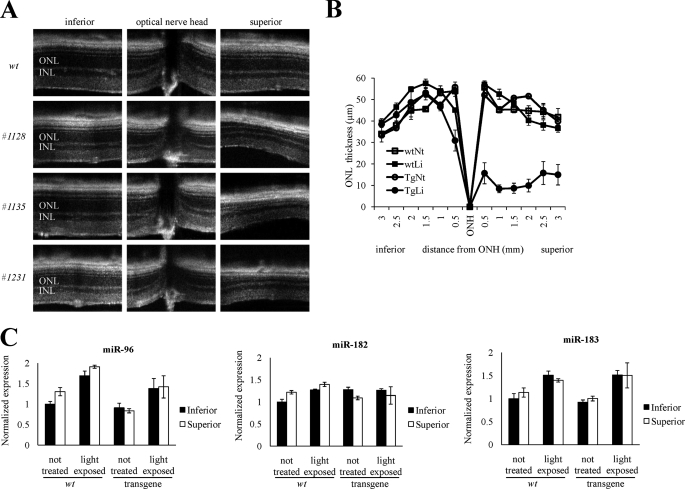
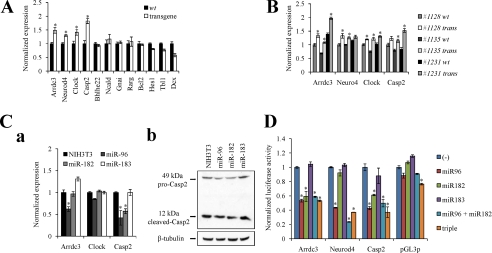
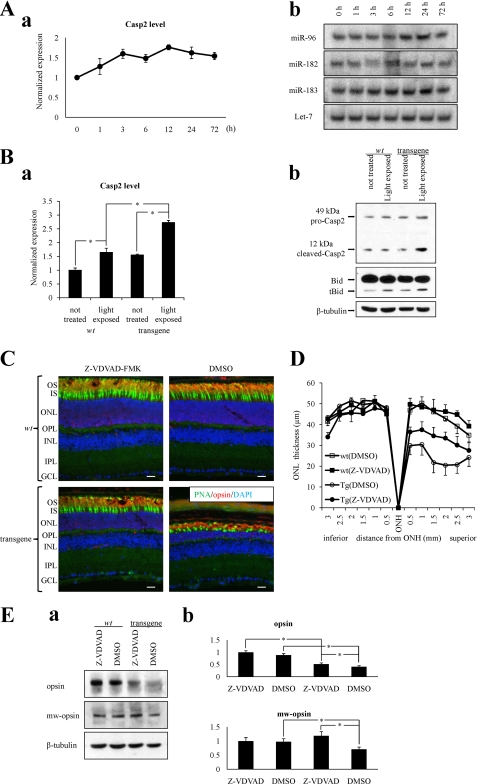
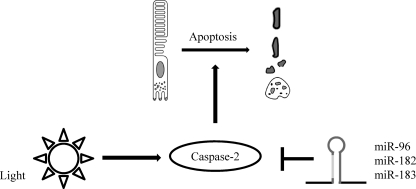
MicroRNA-183 (miR-183), miR-96, and miR-182 comprising the miR-183/96/182 cluster are highly expressed in photoreceptor cells. Although in vitro data have indicated an important role for this cluster in the retina, details of its in vivo biological activity are still unknown. To observe the impact of the miR-183/96/182 cluster on retinal maintenance and light adaptation, we generated a sponge transgenic mouse model that disrupted the activities of the three-component microRNAs simultaneously and selectively in the retina. Although our morphological and functional studies showed no differences between transgenic and wild type mice under normal laboratory lighting conditions, sponge transgenic mice displayed severe retinal degeneration after 30 min of exposure to 10,000 lux light. Histological studies showed that the outer nuclear layer thickness was dramatically reduced in the superior retina of transgenic mice. Real time PCR experiments in both the sponge transgenic mouse model and different microRNA stable cell lines identified Arrdc3, Neurod4, and caspase-2 (Casp2) as probable downstream targets of this cluster, a result also supported by luciferase assay and immunoblotting analyses. Further studies indicated that expression of both the cluster and Casp2 increased in response to light exposure. Importantly, Casp2 expression was enhanced in transgenic mice, and inhibition of Casp2 partially rescued their light-induced retinal degeneration. By connecting the microRNA and apoptotic pathways, these findings imply an important role for the miR-183/96/182 cluster in acute light-induced retinal degeneration of mice. This study demonstrates a clear involvement of miRs in the physiology of postmitotic cells in vivo.


Figures

FIGURE 1.
FIGURE 1.
miR-183/96/182 clusters are specifically expressed in photoreceptor cells. A, quantification of selected miRs by splinted ligation in 4-month-old wild type (wt), Cone-DTA+/−, and Opsin−/− mouse retinas. RNase-free water was used for a negative control and Let-7 as an internal control. miR-183, miR-96, and miR-182 were all significantly decreased in Opsin−/− mice but unchanged in Cone-DTA+/− mice. Compared with WT, miR-107 was unchanged in Cone-DTA+/− and Rho−/− mice. B, quantification of selected miRs by splinted ligation in the retina of 4-month-old WT mice, rd1/rd1 mutant mice (29), and P23H Opsin knock-in homozygous mice (P23H) (30). HeLa cells, derived from a human cervical cancer cell line, were used as a negative control because these cells do not express the miR-183/96/182 cluster. Compared with WT retina, miR-183, miR-96, and miR-182 were decreased in rd1/rd1 and P23H mutant retinas but Let-7 stayed the same, and miR-125a even increased slightly in mutant mice.
FIGURE 2.
FIGURE 2.
Creation of miR-183/96/182 cluster sponge transgenic mice. A, PCR genotyping of the miR-183/96/182 cluster sponge in transgenic mice. Panel a, three transgenic lines are shown with different levels of transgene detected by PCR. Rd_For/Pde_Rev and Pde_For/Pde_Rev primers were used to confirm the absence of the Pde6brd1 mutant allele. PCR of β-actin was used as a control for genomic DNA preparations. Panel b, shown are absolute transgene copy numbers in heterozygotes calculated by real time PCR in different mouse lines. These were 2.1 ± 0.4 in SP1135, 1.3 ± 0.1 in SP1128, and 7.0 ± 1.0 in SP1231, respectively. Error bars represent means ± S.E. B, validation of sponge element expression and function. Panel a, mRNA expression levels of sponge elements in retina were measured by semiquantitative RT-PCR. RT-minus (RT(−)) and Gapdh (Gapdh RT (+)) reactions were used as negative and positive controls. Panel b, splinted ligation shows that mature miR-183, miR-96, and miR-182 were only slightly down-regulated in all three transgenic mouse lines. Amplification cycle numbers for A, panel a, and B, panel a, are indicated on the right.
FIGURE 3.
FIGURE 3.
Bright light induces severe degeneration in the superior retina of 4-month-old miR-183/96/182 sponge cluster transgenic mice. A, B-scanned averaged SD-OCT images of superior mouse retina were taken at 0, 10, and 30 min after 10,000 Lux light exposure. A significant decrease in ONL thickness occurred in transgenic retinas after 10 and 30 min of light exposure. B, representative retinal histology after H&E staining is shown for both WT and transgenic mice after indicated periods of bright light exposure. Transgenic mice exhibited photoreceptor cell death after 10 and 30 min of light exposure, whereas WT control mice displayed no significant retinal degeneration. C, panel a, immunohistochemistry of retinas stained with PNA for cones and anti-Opsin (1D4) antibody for rods; DAPI was used as a counterstain to detect cell nuclei. In transgenic mice, rod cell death occurred after 10 min of light exposure as noted by thinner outer segment and outer nuclear layers. However, cone damage was less pronounced. After 30 min of light exposure, rods nearly disappeared and only a few cones remained. Rods and cones of WT mice were unaffected by the 30-min light exposure. Abbreviations used are as follows: GCL, ganglion cell layer; IPL, inner plexiform layer; INL, inner nuclear layer; OPL, outer plexiform layer; ONL, outer nuclear layer; ELM, external limiting membrane; IS, inner segment; OS, outer segment; RPE, retinal pigmented epithelium. Scale bars, 10 μm. Panel b, immunoblotting studies show that the Opsin level decreased in transgenic mouse retina after 10 min of light exposure, and both Opsin and Mw-opsin levels decreased after 30 min light exposure. In contrast, Opsin and Mw-opsin levels in WT mouse retina remained unchanged after 10 or 30 min of light exposure.
FIGURE 4.
FIGURE 4.
Retinal damage is more severe in the superior retina than in other regions. A, B-scanned averaged SD-OCT images of retinas from three 4-month-old transgenic mice reveal that the superior area was more damaged than the optic disc and inferior area. B, thickness of the outer nuclear retinal layer measured 2 weeks after light exposure is shown. ONL thicknesses were almost identical in the inferior retina of untreated and light-exposed mice, but they were reduced from about 50 to 20 μm in the superior retina of transgenic mice after bright light exposure. Abbreviations used are as follows: INL, inner nuclear layer; ONL, outer nuclear layer; ONH, optic nerve head. Li, light; Nt, not exposed to light. Error bars represent then means ± S.D. (n = 4). C, expression levels of the miR-183/96/182 cluster were the same in mouse superior and inferior retina; locked nucleic acid-based real time PCR showed that miR-96 and miR-183 but not miR-182 increased after light exposure in both WT and transgenic mice. None of these three miRs were differentially expressed in the superior and inferior retina under these conditions. Error bars represent means ± S.E. (n = 3).
FIGURE 5.
FIGURE 5.
Identification of candidate targets of miR-183/96/182 cluster miRs. Predicted miR-183/96/182 targets are listed in Table 1 where their NCBI reference sequences, putative binding miRs, expression levels in retina, and known functions are also shown. A, comparison of candidate target mRNA levels between 4-month-old WT and transgenic mice by real time PCR. Four genes, namely Arrdc3, Neurod4, Clock, and Casp2, out of 11 candidates showed significant increases in transgenic mice. B, confirmation of these target genes by real time PCR. mRNA levels were compared between transgenic mice and their WT littermates. Arrdc3, Neurod4, Clock, and Casp2 mRNAs were all up-regulated in retinas from all three transgenic mouse lines. Real time PCR results were all normalized to Gapdh. Error bars represent means ± S.E. (n = 3). *, p < 0.01. C, target gene changes in stable cell lines. Panel a, mRNA levels of indicated genes in three stable cell lines were detected by real time PCR; Gapdh was used as an internal control. mRNA levels of Arrdc3 in miR-96 stable cells were 62% of those in NIH3T3 cells but were essentially unchanged in miR-182 stable cells and even increased 1.3-fold in miR-183 stable cells. The Clock mRNA levels remained the same in all cell lines. mRNA levels of Casp2 in miR-96 and miR-182 stable cells were 42 and 57% those in NIH3T3 cells but were unchanged in miR-183 stable cells. Error bars represent the means ± S.E. (n = 3), *, p < 0.01. Panel b, protein levels of both pro-Casp2 and cleaved Casp2 in three stable cell lines were documented by immunoblotting with an anti-Casp2 antibody. Both pro-Casp2 and cleaved Casp2 were decreased in miR-96 and miR-182 stable cells but not in miR-183 stable cells. β-Tubulin was used as the internal control. D, confirmation of miR-183/96/182 cluster targets by luciferase assay. miR-96 repressed luciferase activity by 47% in Arrdc3, 57% in Neurod4, and 57% in Casp2 compared with the parental pGL3P vector; miR-182 repressed luciferase activity by 41% in Arrdc3 and 39% in Casp2 compared with the empty vector; and miR-183 made no difference in all target genes. As a negative control, luciferase activity of the empty pGL3P vector was not affected by any miR-183/96/182 cluster miRs. All data were normalized to those obtained with the pGL3P vector alone. Error bars represent means ± S.E. (n = 3), *, p < 0.01.
FIGURE 6.
FIGURE 6.
miR-183/96/182 cluster miRs repress Casp2 during light exposure. A, both miR-183/96/182 cluster miRs and Casp2 expression levels increased in 4-month-old wild type mice after 10,000 Lux white bright light exposure. Panel a, real time PCR shows Casp2 was modestly up-regulated 12–24 h after light exposure. Panel b, splinted ligation data show that miR-96 and miR-183 but not miR-182 increased 12–24 h after light exposure. B, repression of Casp2 is not observed in sponge transgenic mice. Panel a, Casp2 mRNA levels increased more after light exposure in transgenic mice than in WT mice as demonstrated by real time PCR. Panel b, immunoblotting analysis confirms the greater increase of Casp2 protein levels and the enhanced cleavage of Bid protein in light-exposed transgenic mice. C, immunohistochemistry of retinas stained with PNA for cones and anti-Opsin (1D4) antibody for rods; DAPI was used as a counterstain to detect cell nuclei. DMSO-treated 4-month-old sponge transgenic mice showed severe retinal degeneration after light exposure, whereas Z-VDVAD-FMK-treated 4-month-old sponge transgenic mice showed only moderate retinal damage. WT mouse retinas appeared normal in both conditions. Scale bars: 10 μm. D, thicknesses of the outer nuclear retinal layer measured 2 weeks after light exposure are shown. Injection of Z-VDVAD-FMK had a partial protective effect against light-induced structural damage to the retina of transgenic mice. As in transgenic mice, ONL thicknesses in retinas of Z-VDVAD-FMK-treated transgenic mice were about 30 μm in the superior area, whereas in the same area, ONL thicknesses of DMSO-treated transgenic mice were only about 20 μm. Retinas from WT mice were normal, with ONL thicknesses of about 50 μm. Error bars represent means ± S.E. (n = 4). Abbreviations used are as follows: GCL, ganglion cell layer; IPL, inner plexiform layer; INL, inner nuclear layer; OPL, outer plexiform layer; ONL, outer nuclear layer; ELM, external limiting membrane; IS, inner segment; OS, outer segment; RPE, retinal pigmented epithelium; ONH, optic nerve head. E, panel a, immunoblotting data show that without Z-VDVAD-FMK treatment, the Opsin level in 4-month-old sponge transgenic mouse retina was only 40% that in WT littermate retina after light exposure, and the Mw-opsin level in the transgenic mouse retina was only 70% that in WT retina. But with Z-VDVAD-FMK treatment, the Opsin level in 4-month-old sponge transgenic mouse retina was 50% that in the retina of WT littermates after light exposure, and the Mw-opsin level in transgenic retina was even slightly increased. Statistical analyses are shown in panel b. Error bars represent means ± S.E. (n = 3), *, p < 0.05.
FIGURE 7.
FIGURE 7.
Model of miR-183/96/182 cluster-mediated regulation of Casp2 protein and function in retinal degeneration. miR-183/96/182 cluster miRs repress Casp2 expression after bright light exposure, thereby protecting photoreceptors from apoptosis.

Similar articles

Cited by

References

    1. Bartel D. P. (2009) Cell 136, 215–233 - PMC - PubMed
    1. Bartel D. P. (2004) Cell 116, 281–297 - PubMed
    1. Tanzer A., Stadler P. F. (2004) J. Mol. Biol. 339, 327–335 - PubMed
    1. Friedman R. C., Farh K. K., Burge C. B., Bartel D. P. (2009) Genome Res. 19, 92–105 - PMC - PubMed
    1. Lagos-Quintana M., Rauhut R., Yalcin A., Meyer J., Lendeckel W., Tuschl T. (2002) Curr. Biol. 12, 735–739 - PubMed

Publication types