

Changes in the tension in dsDNA alter the conformation of RecA bound to dsDNA-RecA filaments
- PMID: 21768124
- PMCID: PMC3203582
- DOI: 10.1093/nar/gkr561
Changes in the tension in dsDNA alter the conformation of RecA bound to dsDNA-RecA filaments
Abstract
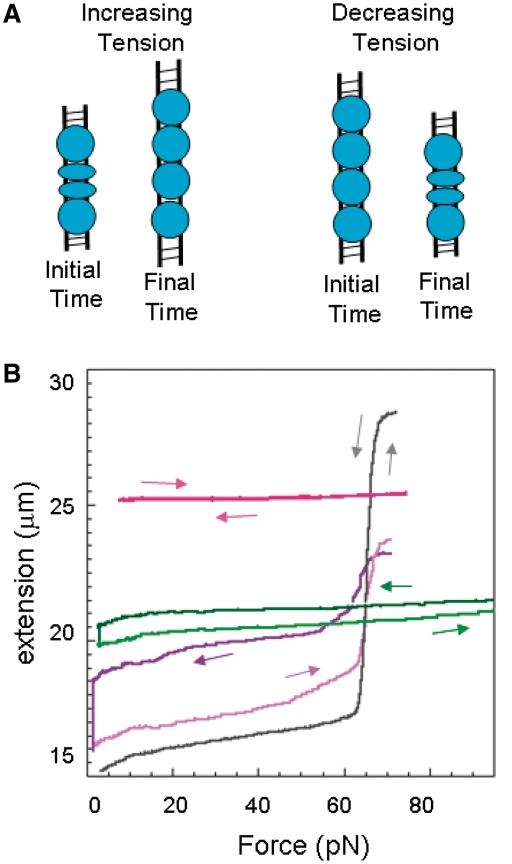
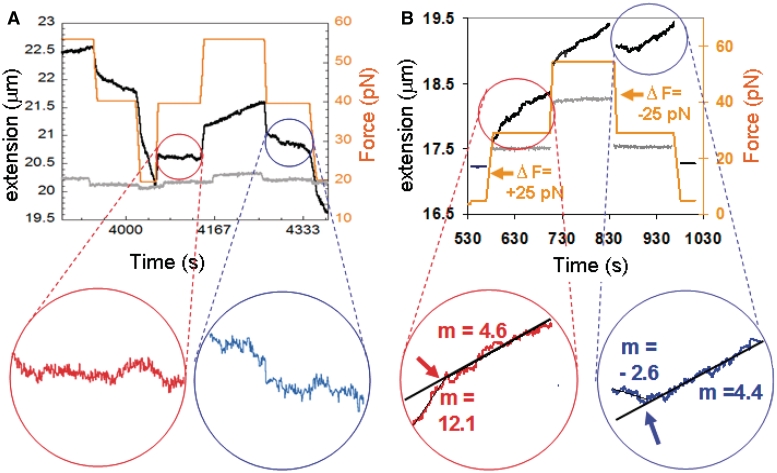
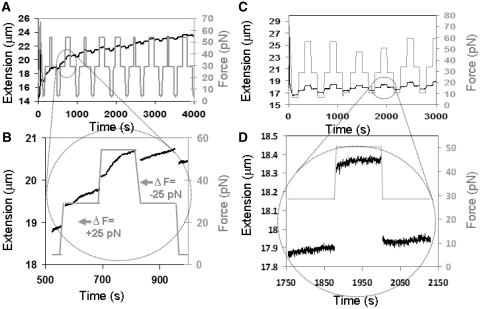
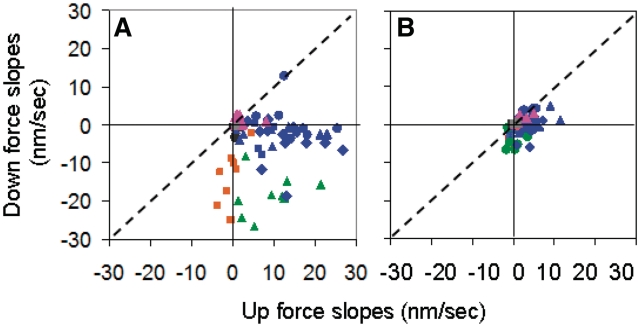
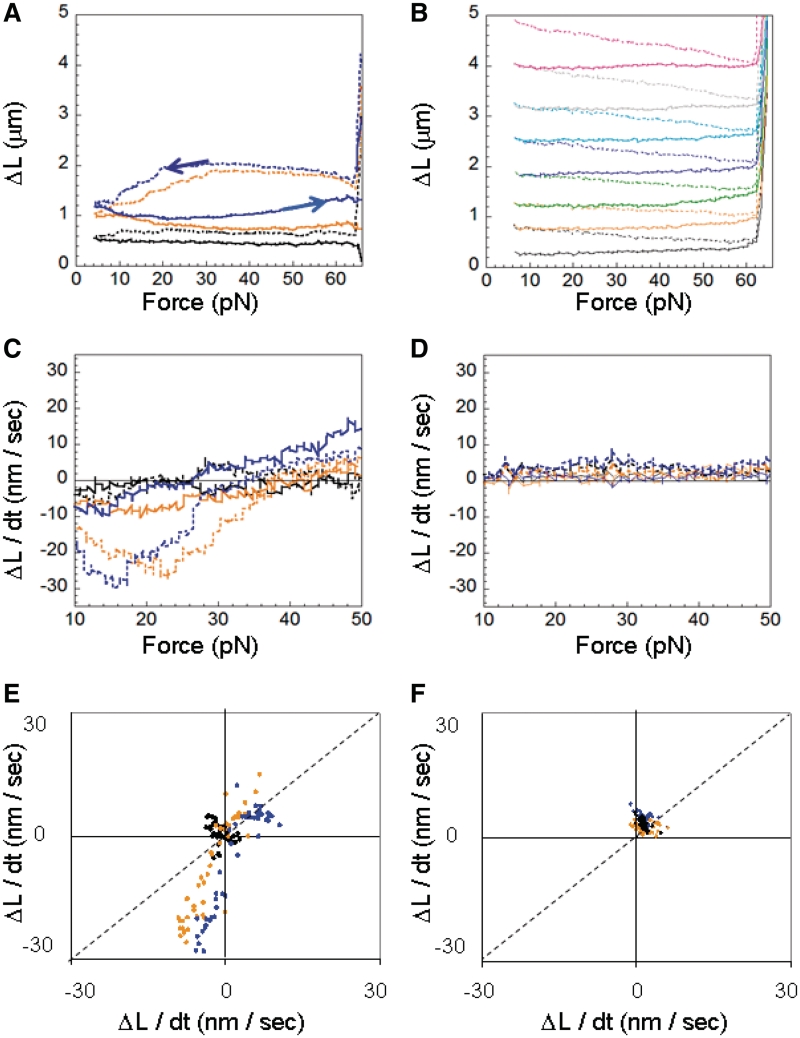
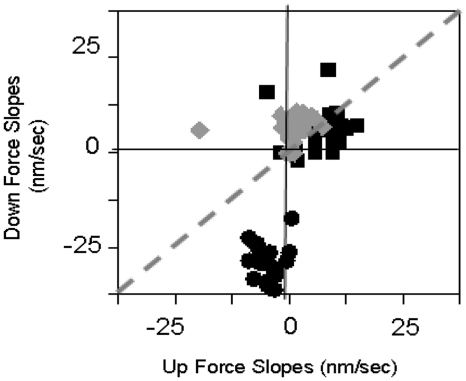
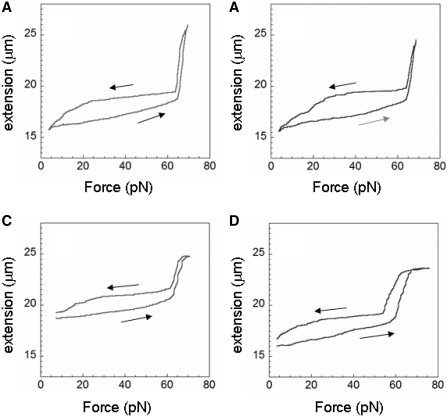
The RecA protein is an ATPase that mediates recombination via strand exchange. In strand exchange a single-stranded DNA (ssDNA) bound to RecA binding site I in a RecA/ssDNA filament pairs with one strand of a double-stranded DNA (dsDNA) and forms heteroduplex dsDNA in site I if homology is encountered. Long sequences are exchanged in a dynamic process in which initially unbound dsDNA binds to the leading end of a RecA/ssDNA filament, while heteroduplex dsDNA unbinds from the lagging end via ATP hydrolysis. ATP hydrolysis is required to convert the active RecA conformation, which cannot unbind, to the inactive conformation, which can unbind. If dsDNA extension due to RecA binding increases the dsDNA tension, then RecA unbinding must decrease tension. We show that in the presence of ATP hydrolysis decreases in tension induce decreases in length whereas in the absence of hydrolysis, changes in tension have no systematic effect. These results suggest that decreases in force enhance dissociation by promoting transitions from the active to the inactive RecA conformation. In contrast, increases in tension reduce dissociation. Thus, the changes in tension inherent to strand exchange may couple with ATP hydrolysis to increase the directionality and stringency of strand exchange.
Figures
Similar articles
-
Mechanism of homologous recombination from the RecA-ssDNA/dsDNA structures.Nature. 2008 May 22;453(7194):489-4. doi: 10.1038/nature06971. Nature. 2008. PMID: 18497818
-
RecA protein dynamics in the interior of RecA nucleoprotein filaments.J Mol Biol. 1996 Apr 12;257(4):756-74. doi: 10.1006/jmbi.1996.0200. J Mol Biol. 1996. PMID: 8636980
-
Complementary strand relocation may play vital roles in RecA-based homology recognition.Nucleic Acids Res. 2012 Nov 1;40(20):10441-51. doi: 10.1093/nar/gks769. Epub 2012 Aug 31. Nucleic Acids Res. 2012. PMID: 22941658 Free PMC article.
-
Structure/function relationships in RecA protein-mediated homology recognition and strand exchange.Crit Rev Biochem Mol Biol. 2015;50(6):453-76. doi: 10.3109/10409238.2015.1092943. Epub 2015 Oct 13. Crit Rev Biochem Mol Biol. 2015. PMID: 26459995 Review.
-
RecA and DNA recombination: a review of molecular mechanisms.Biochem Soc Trans. 2019 Oct 31;47(5):1511-1531. doi: 10.1042/BST20190558. Biochem Soc Trans. 2019. PMID: 31654073 Review.
Cited by
-
Probing Rad51-DNA interactions by changing DNA twist.Nucleic Acids Res. 2012 Dec;40(22):11769-76. doi: 10.1093/nar/gks1131. Epub 2012 Nov 24. Nucleic Acids Res. 2012. PMID: 23180779 Free PMC article.
-
Plasticity and Co-Factor-Dependent Structural Changes in the RecA Nucleoprotein Filament Studied by Small-Angle X-Ray Scattering (SAXS) Measurements and Molecular Modeling.Molecules. 2025 Apr 16;30(8):1793. doi: 10.3390/molecules30081793. Molecules. 2025. PMID: 40333744 Free PMC article.
-
An integrative approach to the study of filamentous oligomeric assemblies, with application to RecA.PLoS One. 2015 Mar 18;10(3):e0116414. doi: 10.1371/journal.pone.0116414. eCollection 2015. PLoS One. 2015. PMID: 25785454 Free PMC article.
-
Different relative scalings between transient forces and thermal fluctuations tune regimes of dynamic clustering.Phys Rev E. 2025 Apr;111(4-1):044407. doi: 10.1103/PhysRevE.111.044407. Phys Rev E. 2025. PMID: 40411068 Free PMC article.
-
Tension on dsDNA bound to ssDNA-RecA filaments may play an important role in driving efficient and accurate homology recognition and strand exchange.Phys Rev E Stat Nonlin Soft Matter Phys. 2013 Mar;87(3):032702. doi: 10.1103/PhysRevE.87.032702. Epub 2013 Mar 5. Phys Rev E Stat Nonlin Soft Matter Phys. 2013. PMID: 27499708 Free PMC article.
References
-
- Lusetti SL, Cox MM. The bacterial RecA protein and the recombinational DNA repair of stalled replication forks. Annu. Rev. Biochem. 2002;71:71–100. - PubMed
-
- Cox MM. Regulation of bacterial RecA protein function. Crit. Rev. Biochem. Mol. Biol. 2007;42:41–63. - PubMed
-
- Kowalczykowski SC. Initiation of genetic recombination and recombination-dependent replication. Trends Biochem. Sci. 2000;25:156–165. - PubMed
-
- Müller B, Koller T, Stasiak A. Characterization of the DNA binding activity of stable RecA-DNA complexes. Interaction between the two DNA binding sites within RecA helical filaments. J. Mol. Biol. 1990;212:97–112. - PubMed
Publication types
MeSH terms
Substances
Grants and funding
LinkOut - more resources
Full Text Sources
Molecular Biology Databases
