Review
. 2011 Aug 27;366(1576):2379-90.
doi: 10.1098/rstb.2011.0048.

The comparative ecology and biogeography of parasites

Affiliations
Review

The comparative ecology and biogeography of parasites

Robert Poulin et al. Philos Trans R Soc Lond B Biol Sci. .

Abstract

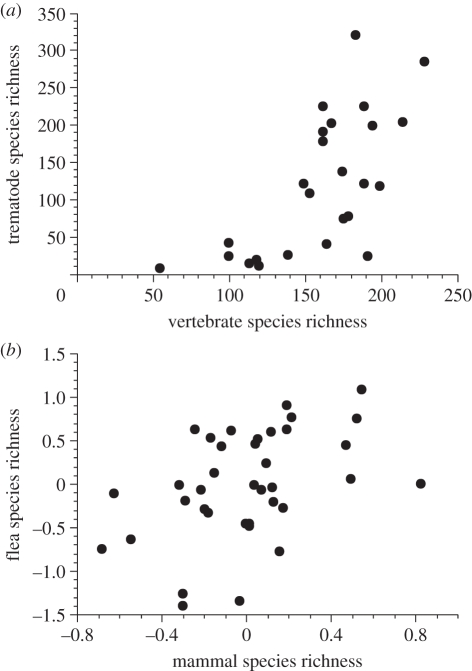
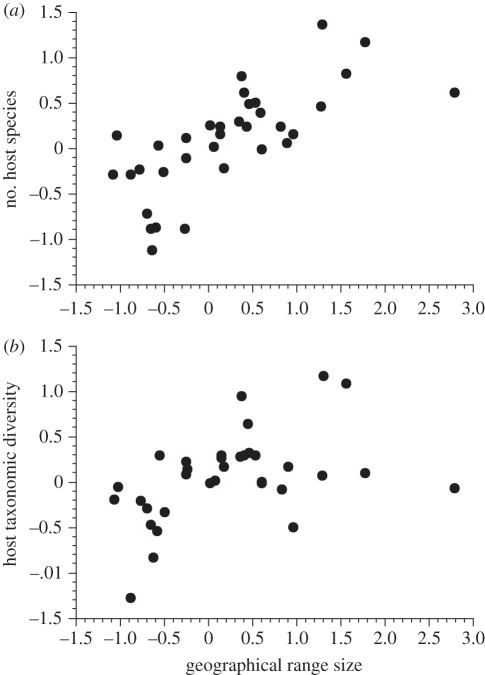
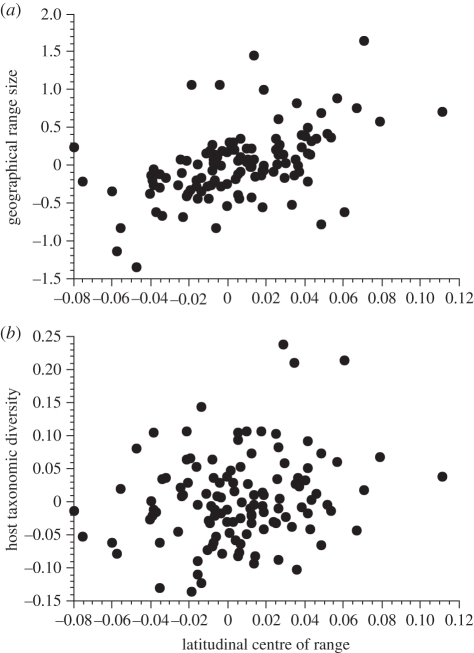
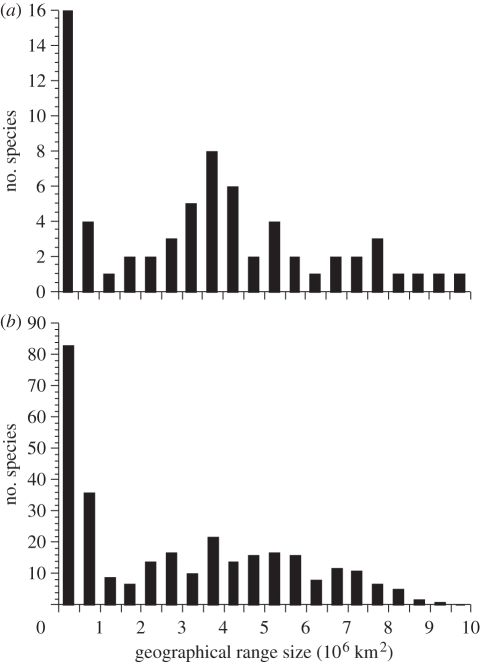
Comparative ecology uses interspecific relationships among traits, while accounting for the phylogenetic non-independence of species, to uncover general evolutionary processes. Applied to biogeographic questions, it can be a powerful tool to explain the spatial distribution of organisms. Here, we review how comparative methods can elucidate biogeographic patterns and processes, using analyses of distributional data on parasites (fleas and helminths) as case studies. Methods exist to detect phylogenetic signals, i.e. the degree of phylogenetic dependence of a given character, and either to control for these signals in statistical analyses of interspecific data, or to measure their contribution to variance. Parasite-host interactions present a special case, as a given trait may be a parasite trait, a host trait or a property of the coevolved association rather than of one participant only. For some analyses, it is therefore necessary to correct simultaneously for both parasite phylogeny and host phylogeny, or to evaluate which has the greatest influence on trait expression. Using comparative approaches, we show that two fundamental properties of parasites, their niche breadth, i.e. host specificity, and the nature of their life cycle, can explain interspecific and latitudinal variation in the sizes of their geographical ranges, or rates of distance decay in the similarity of parasite communities. These findings illustrate the ways in which phylogenetically based comparative methods can contribute to biogeographic research.


Figures

Figure 1.
Figure 1.
Parasite species richness as a function of host species richness across geographical areas, for (a) freshwater trematodes and their vertebrate hosts from 25 biogeographic regions in Europe, and (b) fleas and their small mammalian hosts from 37 regions of the world. Data on fleas and mammals are corrected for host sampling effort and area size, i.e. they are residuals from a multiple regression (data from Krasnov et al. [28] and Thieltges et al. [29]).
Figure 2.
Figure 2.
Hypothetical scenarios for the influence of host or parasite phylogeny on trait expression in five parasite species occurring on five host species. Realized host–parasite species combinations are indicated by boxes aligned with branch tips of either the host or parasite phylogenetic tree; the parasites are assumed to be generalists capable of infecting more than one host species, and in turn each host species harbours more than one parasite species. The magnitude of trait expression is indicated by the shading inside each box, ranging from low (white) through moderate (grey) to strong (black) expression. Trait expression can be influenced (a) by parasite phylogeny only, regardless of what host species a parasite infects, (b) by host phylogeny only, to a similar extent in all parasites infecting a given host species or (c) by a combination of both phylogenies acting in concert.
Figure 3.
Figure 3.
Changes in parasite species richness in host lineages over phylogenetic time. The shaded area represents the phylogenetic relationships among three host species. The lines mapped onto this phylogeny identify parasite lineages (denoted af). When the host speciates, parasites often co-speciate such that each daughter host species inherits the ancestor's parasites (lineage a). Parasites can also ‘miss the boat’ during host speciation (lineages b and c not inherited by host 3), or go extinct some time after host speciation (lineage c, black circle), and thus be absent from one or more daughter host species. New parasites are acquired by hosts through colonization (i.e. host-switching, lineages df, shown by arrows) or following intrahost parasite speciation, i.e. parasite duplication without host speciation (in lineage b, shown by star). The result is that related host species harbour different numbers of parasites from each other and from their common ancestor.
Figure 4.
Figure 4.
Relationships between geographical range size (square kilometres) and two measures of host specificity, (a) the number of host species exploited and (b) their average taxonomic distinctness, across flea species parasitic on small mammals in Australia. Data are phylogenetically independent contrasts computed on log-transformed values (data from Krasnov et al. [71]).
Figure 5.
Figure 5.
Relationships between the latitude of the centre of the geographical range and (a) flea geographical range size (square kilometres) and (b) the average taxonomic distinctness of host species exploited, across flea species parasitic on small mammals in the Palaearctic. Data are phylogenetically independent contrasts computed on log-transformed values (data from Krasnov et al. [57]).
Figure 6.
Figure 6.
Frequency distribution of geographical range sizes for European freshwater trematode species parasitic in (a) fish definitive hosts (n = 67) and (b) bird definitive hosts (n = 307) (data from Thieltges et al. [80]).
Figure 7.
Figure 7.
Similarity between parasite communities plotted against the geographical distance between them, for all pairwise comparisons of metazoan parasite communities found in threespine stickleback, Gasterosteus aculeatus, populations from different localities in Eurasia. Similarity is measured as the Jaccard index, i.e. the proportion of shared parasite species out of the total from two localities. Different symbols show values for pairs of localities from the same habitat type based on salinity (both localities either marine or freshwater; open circles), or from contrasting habitats (one is freshwater and the other is marine; filled circles) (data from Poulin et al. [89]).

References

    1. McIntosh R. 1985. The background of ecology: concept and theory. New York, NY: Cambridge University Press
    1. Brooks D. R., McLennan D. A. 1991. Phylogeny, ecology, and behavior. Chicago, IL: University of Chicago Press
    1. Schoener T. W. 1965. The evolution of bill size differences among sympatric congeneric species of birds. Evolution 19, 189–21310.2307/2406374 (doi:10.2307/2406374) - DOI - DOI
    1. Schoener T. W., Gorman G. C. 1968. Some niche differences in three Lesser Antillean lizards of the genus Anolis. Ecology 49, 819–83010.2307/1936533 (doi:10.2307/1936533) - DOI - DOI
    1. Roughgarden J. 1974. Niche width: biogeographic patterns among Anolis lizard populations. Am. Nat. 108, 429–44210.1086/282924 (doi:10.1086/282924) - DOI - DOI