

Effects of long-term cranberry supplementation on endocrine pancreas in aging rats
- PMID: 21768504
- PMCID: PMC3193520
- DOI: 10.1093/gerona/glr105
Effects of long-term cranberry supplementation on endocrine pancreas in aging rats
Abstract
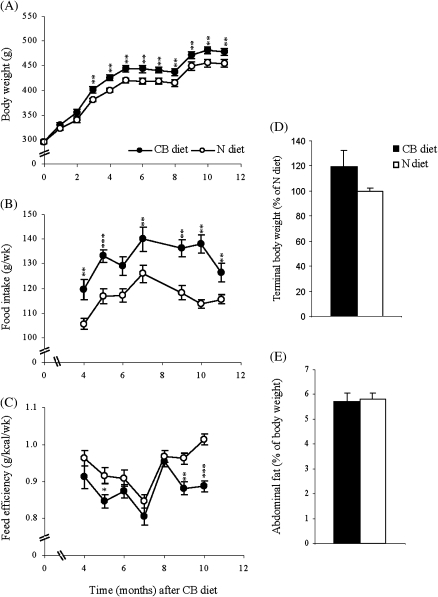
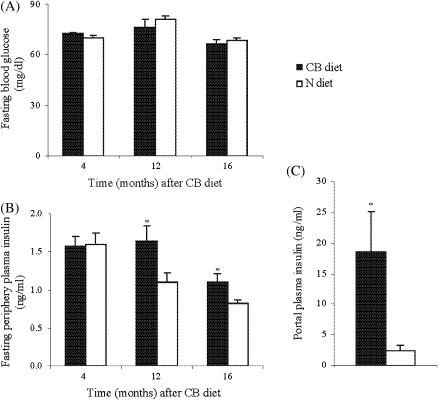
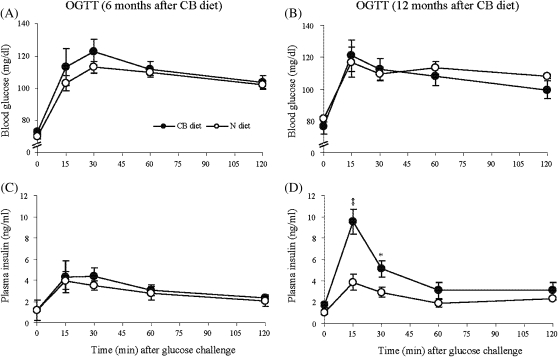
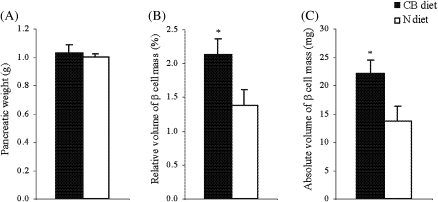
The effects of long-term cranberry consumption on age-related changes in endocrine pancreas are not fully understood. Here we treated male Fischer 344 rats with either 2% whole cranberry powder supplemented or normal rodent chow from 6 to 22 month old. Both groups displayed an age-related decline in basal plasma insulin concentrations, but this age-related decline was delayed by cranberry. Cranberry supplementation led to increased β-cell glucose responsiveness during the oral glucose tolerance test. Portal insulin concentration was 7.6-fold higher in rats fed cranberry, coupled with improved β-cell function. However, insulin resistance values were similar in both groups. Total β-cell mass and expression of pancreatic and duodenal homeobox 1 and insulin within islets were significantly enhanced in rats fed cranberry relative to controls. Furthermore, cranberry increased insulin release of an insulin-producing β-cell line, revealing its insulinotropic effect. These findings suggest that cranberry is of particular benefit to β-cell function in normal aging rats.
Figures


Similar articles
-
Lifespan extension by cranberry supplementation partially requires SOD2 and is life stage independent.Exp Gerontol. 2014 Feb;50:57-63. doi: 10.1016/j.exger.2013.11.020. Epub 2013 Dec 4. Exp Gerontol. 2014. PMID: 24316039 Free PMC article.
-
Effects of dietary consumption of cranberry powder on metabolic parameters in growing rats fed high fructose diets.Food Funct. 2010 Oct;1(1):116-23. doi: 10.1039/c0fo00089b. Epub 2010 Sep 22. Food Funct. 2010. PMID: 21776462
-
Glucagon-like peptide-1 induces cell proliferation and pancreatic-duodenum homeobox-1 expression and increases endocrine cell mass in the pancreas of old, glucose-intolerant rats.Endocrinology. 2000 Dec;141(12):4600-5. doi: 10.1210/endo.141.12.7806. Endocrinology. 2000. PMID: 11108273
-
Effects of blueberry and cranberry consumption on type 2 diabetes glycemic control: A systematic review.Crit Rev Food Sci Nutr. 2019;59(11):1816-1828. doi: 10.1080/10408398.2018.1430019. Epub 2018 Feb 13. Crit Rev Food Sci Nutr. 2019. PMID: 29345498
-
Cranberry Consumption Against Urinary Tract Infections: Clinical Stateof- the-Art and Future Perspectives.Curr Pharm Biotechnol. 2018;19(13):1049-1063. doi: 10.2174/1389201020666181206104129. Curr Pharm Biotechnol. 2018. PMID: 30520372 Review.
Cited by
-
Supplement timing of cranberry extract plays a key role in promoting Caenorhabditis elegans healthspan.Nutrients. 2014 Feb 21;6(2):911-21. doi: 10.3390/nu6020911. Nutrients. 2014. PMID: 24566444 Free PMC article.
-
Select Polyphenol-Rich Berry Consumption to Defer or Deter Diabetes and Diabetes-Related Complications.Nutrients. 2020 Aug 21;12(9):2538. doi: 10.3390/nu12092538. Nutrients. 2020. PMID: 32825710 Free PMC article. Review.
-
Lifespan extension by cranberry supplementation partially requires SOD2 and is life stage independent.Exp Gerontol. 2014 Feb;50:57-63. doi: 10.1016/j.exger.2013.11.020. Epub 2013 Dec 4. Exp Gerontol. 2014. PMID: 24316039 Free PMC article.
-
Age-associated proinflammatory secretory phenotype in vascular smooth muscle cells from the non-human primate Macaca mulatta: reversal by resveratrol treatment.J Gerontol A Biol Sci Med Sci. 2012 Aug;67(8):811-20. doi: 10.1093/gerona/glr228. Epub 2012 Jan 4. J Gerontol A Biol Sci Med Sci. 2012. PMID: 22219513 Free PMC article.
-
Cranberry interacts with dietary macronutrients to promote healthy aging in Drosophila.J Gerontol A Biol Sci Med Sci. 2014 Aug;69(8):945-54. doi: 10.1093/gerona/glt161. Epub 2013 Oct 22. J Gerontol A Biol Sci Med Sci. 2014. PMID: 24149429 Free PMC article.
References
-
- Szoke E, Shrayyef MZ, Messing S, et al. Effect of aging on glucose homeostasis: accelerated deterioration of beta-cell function in individuals with impaired glucose tolerance. Diabetes Care. 2008;31:539–543. - PubMed
-
- Ihm SH, Moon HJ, Kang JG, et al. Effect of aging on insulin secretory function and expression of beta cell function-related genes of islets. Diabetes Res Clin Pract. 2007;77(suppl 1):S150–S154. - PubMed
-
- Chang AM, Halter JB. Aging and insulin secretion. Am J Physiol Endocrinol Metab. 2003;284:E7–E12. - PubMed
-
- Iozzo P, Beck-Nielsen H, Laakso M, Smith U, Yki-Jarvinen H, Ferrannini E. Independent influence of age on basal insulin secretion in nondiabetic humans. European Group for the Study of Insulin Resistance. J Clin Endocrinol Metab. 1999;84:863–868. - PubMed
Publication types
MeSH terms
Substances
Grants and funding
LinkOut - more resources
Full Text Sources
Medical
Research Materials
