Comparative Study
. 2011 Oct;34(4):928-34.
doi: 10.1002/jmri.22701. Epub 2011 Jul 18.

Reproducibility of MRI-determined proton density fat fraction across two different MR scanner platforms

Affiliations
Comparative Study

Reproducibility of MRI-determined proton density fat fraction across two different MR scanner platforms

Geraldine H Kang et al. J Magn Reson Imaging. 2011 Oct.

Abstract

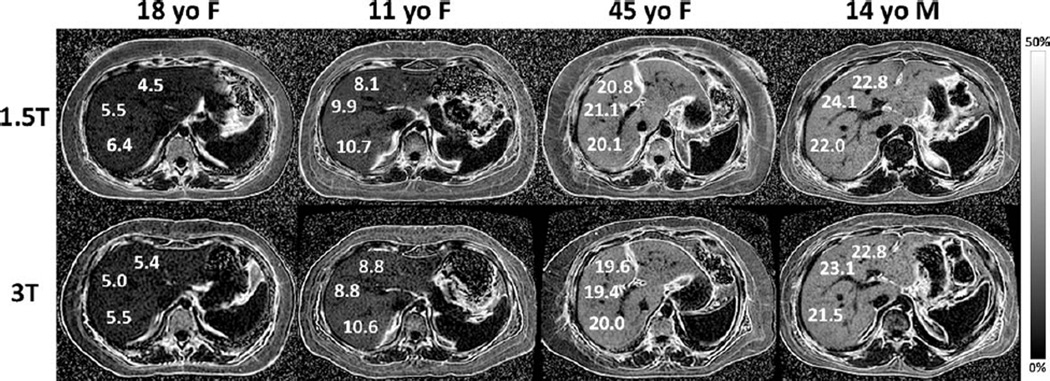
Purpose: To evaluate magnetic resonance imaging (MRI)-determined proton density fat fraction (PDFF) reproducibility across two MR scanner platforms and, using MR spectroscopy (MRS)-determined PDFF as reference standard, to confirm MRI-determined PDFF estimation accuracy.

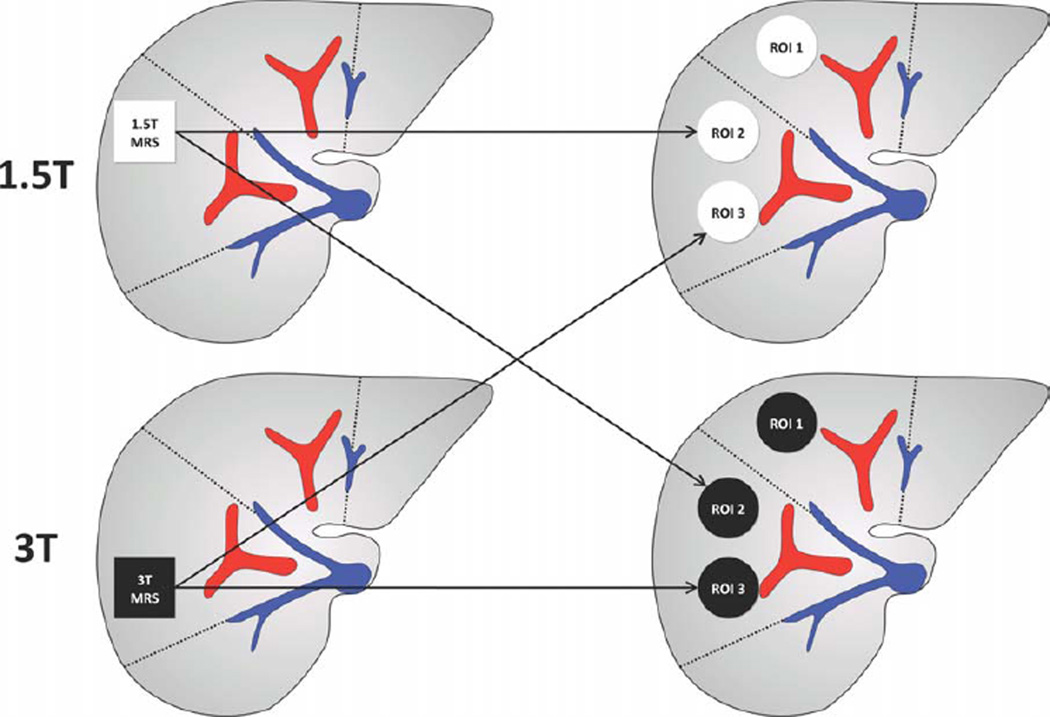
Materials and methods: This prospective, cross-sectional, crossover, observational pilot study was approved by an Institutional Review Board. Twenty-one subjects gave written informed consent and underwent liver MRI and MRS at both 1.5T (Siemens Symphony scanner) and 3T (GE Signa Excite HD scanner). MRI-determined PDFF was estimated using an axial 2D spoiled gradient-recalled echo sequence with low flip-angle to minimize T1 bias and six echo-times to permit correction of T2* and fat-water signal interference effects. MRS-determined PDFF was estimated using a stimulated-echo acquisition mode sequence with long repetition time to minimize T1 bias and five echo times to permit T2 correction. Interscanner reproducibility of MRI determined PDFF was assessed by correlation analysis; accuracy was assessed separately at each field strength by linear regression analysis using MRS-determined PDFF as reference standard.

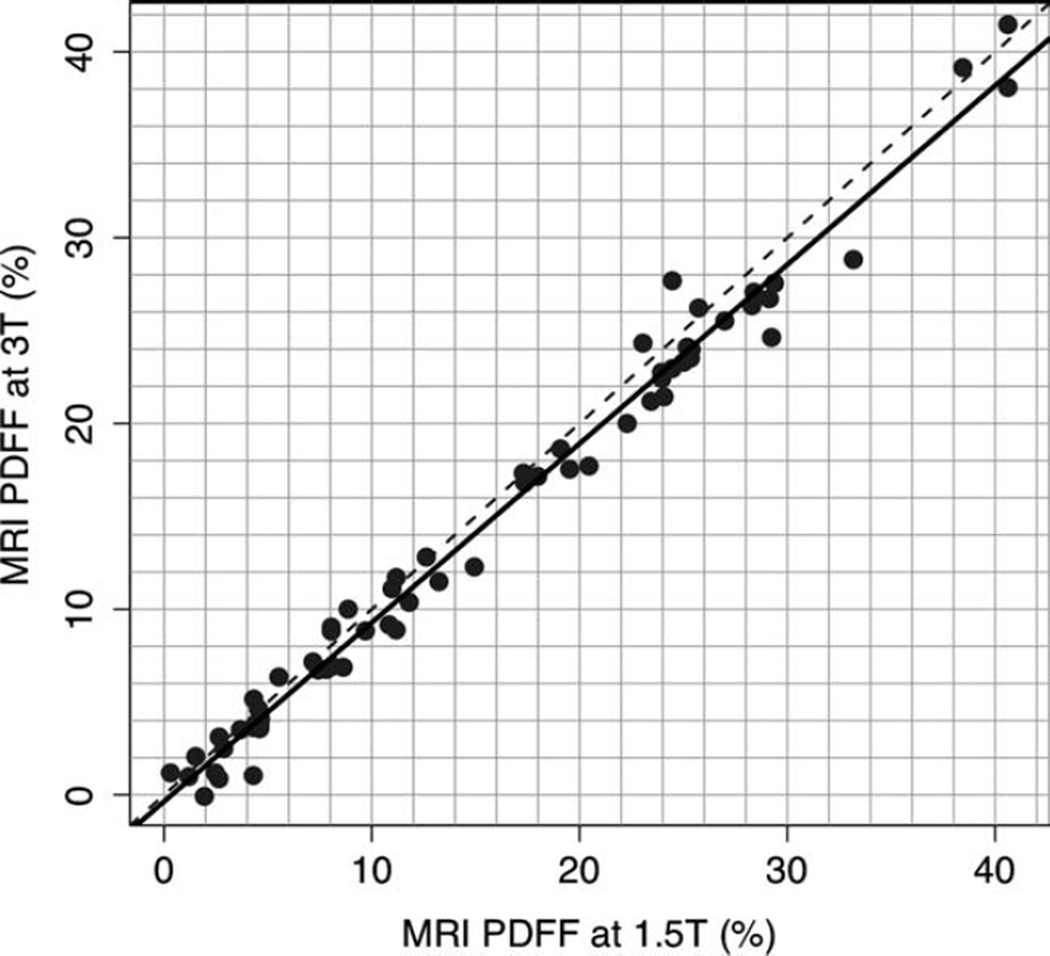
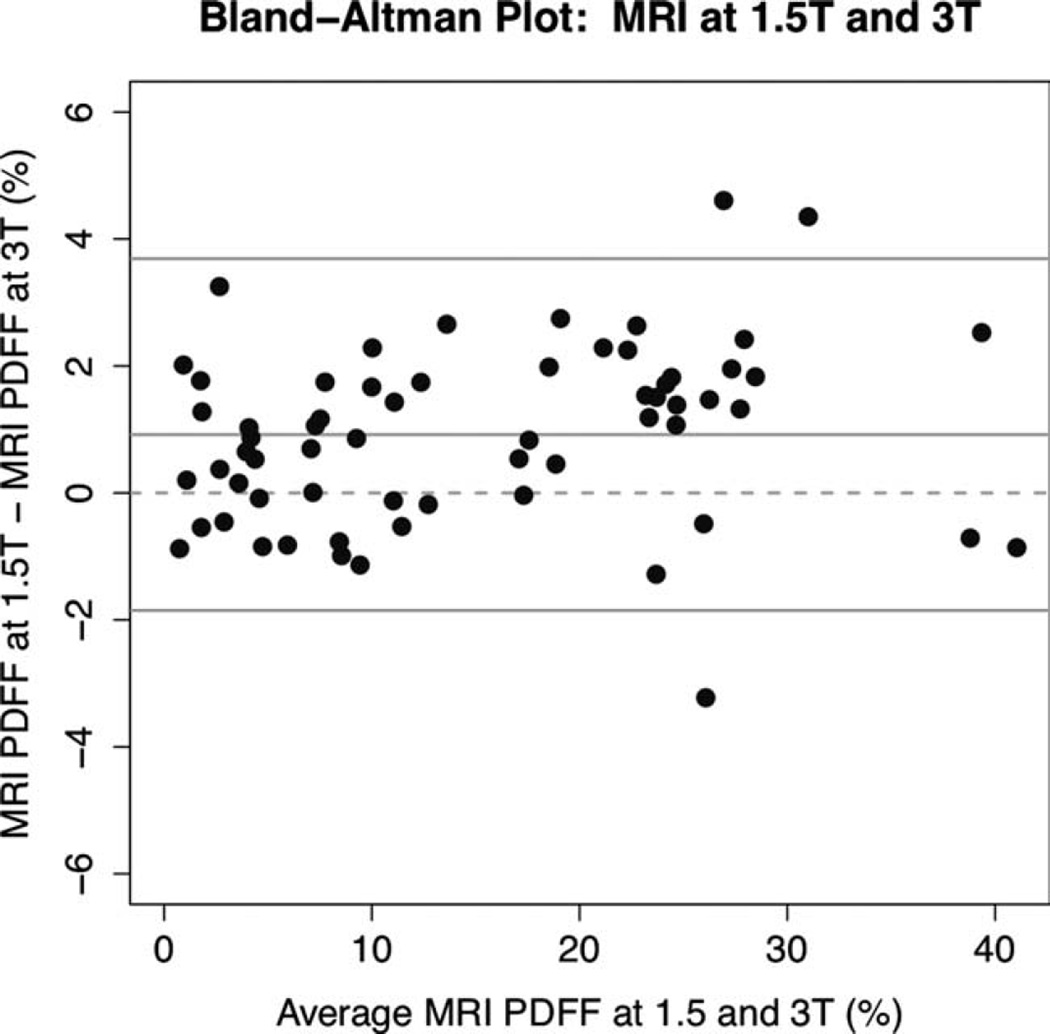
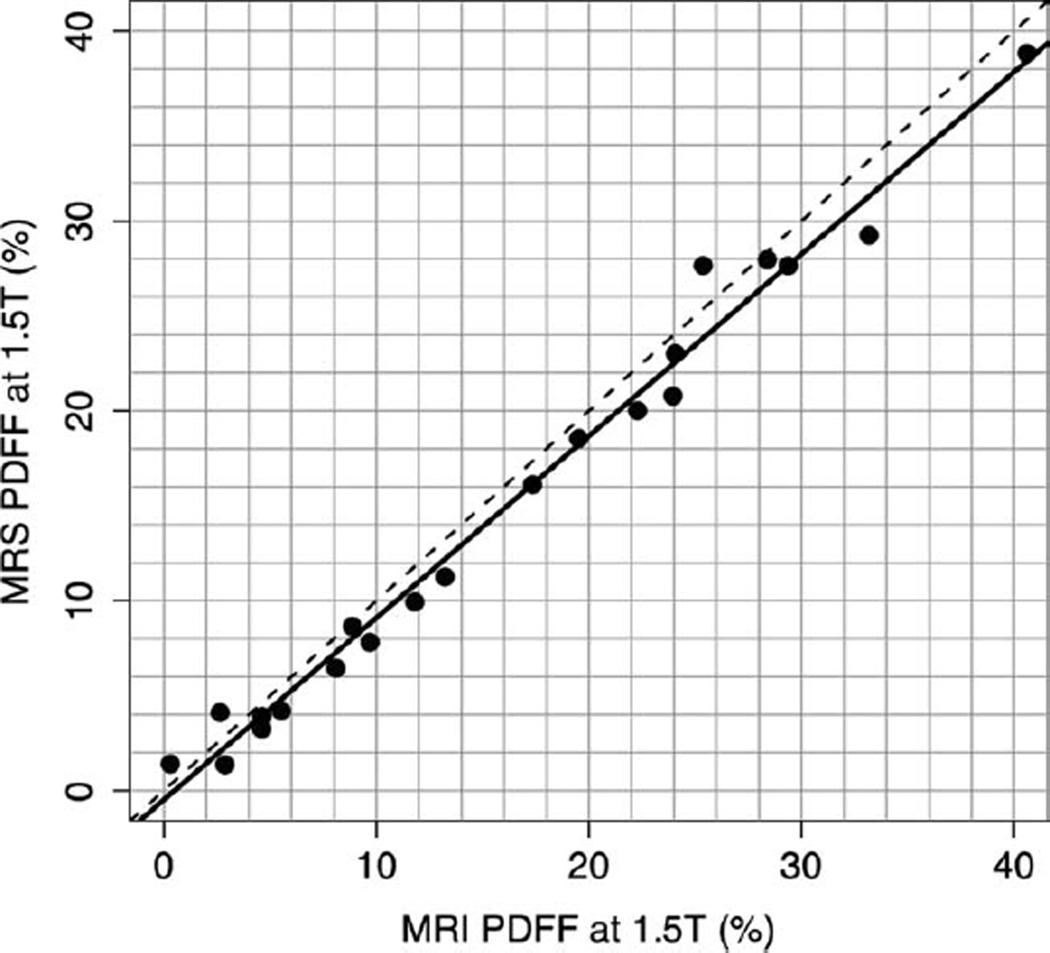
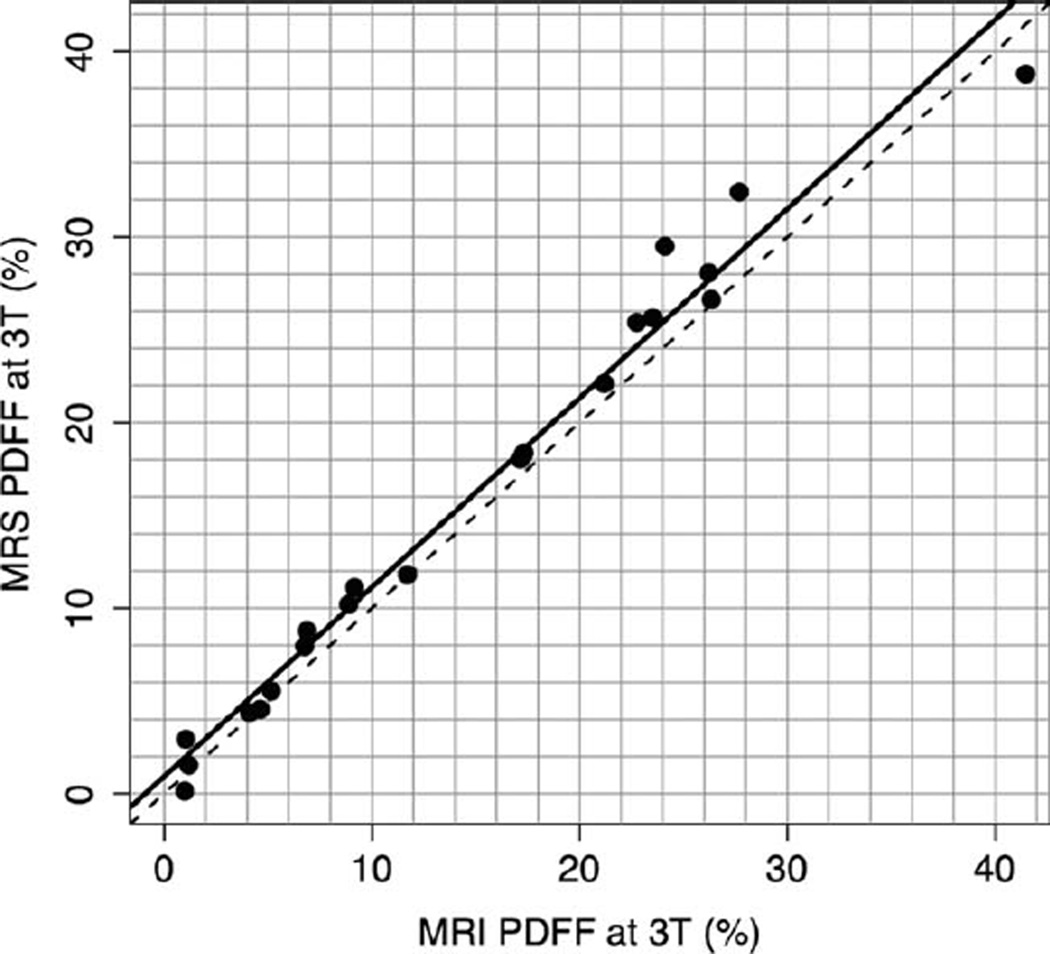
Results: 1.5T and 3T MRI-determined PDFF estimates were highly correlated (r = 0.992). MRI-determined PDFF estimates were accurate at both 1.5T (regression slope/intercept = 0.958/-0.48) and 3T (slope/intercept = 1.020/0.925) against the MRS-determined PDFF reference.

Conclusion: MRI-determined PDFF estimation is reproducible and, using MRS-determined PDFF as reference standard, accurate across two MR scanner platforms at 1.5T and 3T.


Figures

Figure 1
Figure 1
Location of MRS voxels and MRI ROIs. The research design for this pilot study is summarized. Twenty-one subjects underwent two MR exams— one on a 1.5T Siemens scanner and one on a 3T GE scanner—in a crossover design, with time interval range between exams as shown. The order of exams was based on scanner availability: six subjects had 1.5T exams first, and 15 had 3T exams first. The PDFF was estimated using MRI and MRS data acquired in each exam.
Figure 2
Figure 2
1.5T versus 3T MR imaging-determined PDFF reproducibility. MRI-determined PDFF estimations at 1.5T are plotted against MRI-determined PDFF estimations at 3T. Plot shows high interscanner reproducibility (r = 0.992) for PDFF measurements on the two scanners. The 1.5T Siemens scanner PDFF estimate was higher than the 3T GE scanner PDFF estimate by 0.92% on average (P < 0.0001). The dotted line is the line of equality.
Figure 3
Figure 3
MRI-determined PDFF parametric maps of four subjects with NAFLD 18-year-old female, 11-year-old female, 45-year-old female, and 14-year-old male), showing direct comparison of liver fat content for three ROIs placed in each liver at both 1.5T (top row) and 3T (bottom row). The ROIs shown are for illustration purposes and are not necessarily those used in data analysis. Note the close qualitative and quantitative agreement in MRI-determined PDFF at 1.5T and at 3T across the wide range of liver fat content in the four subjects. The parametric maps were generated from source images by applying pixel-by-pixel the PDFF modeling algorithm described in the text. Maps are displayed with a PDFF range from 0%–50%. Subcutaneous adipose tissue appears dark on the parametric maps because the fat fraction in adipose tissue exceeds the 0%–50% PDFF range of magnitude-based MRI techniques.
Figure 4
Figure 4
Bland–Altman plot of 1.5T and 3T MRI-determined PDFF estimates. The Bland–Altman plot shows that the 1.5T Siemens scanner PDFF estimate was higher than the 3T GE scanner PDFF estimate by 0.92% on average (P < 0.0001). Differences were smaller in subjects with lower average PDFF values.
Figure 5
Figure 5
1.5T MRI-determined PDFF versus 1.5T MRS-determined PDFF. This graph illustrates the high fat estimation accuracy of MRI-determined PDFF, using MRS-determined PDFF as the reference standard, at 1.5T (r = 0.993). The slope of the regression equation was 0.958 and the intercept was −0.48. On average, the MRI-determined PDFF estimates were higher than MRS-determined PDFF estimates by 1.15% (P = 0.0015). The dotted line is the line of equality. The solid line is the regression line.
Figure 6
Figure 6
3T MRI-determined PDFF versus 3T MRS-determined PDFF. This graph illustrates the high fat estimation accuracy of MRI-determined PDFF, using MRS-determined PDFF as the reference standard, at 3T (r = 0.989). The slope of the regression equation was 1.020 and the intercept was 0.925. On average, the MRI-determined PDFF estimates were lower than MRS-determined PDFF estimates by 1.22% (P = 0.0044). The dotted line is the line of equality. The solid line is the regression line.

References

    1. Lavine JE, Schwimmer JB. Nonalcoholic fatty liver disease in the pediatric population. Clin Liver Dis. 2004;8:549–558. viii–ix. - PubMed
    1. Sanyal AJ. AGA technical review on nonalcoholic fatty liver disease. Gastroenterology. 2002;123:1705–1725. - PubMed
    1. Farrell GC, Larter CZ. Nonalcoholic fatty liver disease: from steatosis to cirrhosis. Hepatology. 2006;43(2 Suppl 1):S99–S112. - PubMed
    1. Negro F, Sanyal AJ. Hepatitis C virus, steatosis and lipid abnormalities: clinical and pathogenic data. Liver Int. 2009;29(Suppl 2):26–37. - PubMed
    1. Brunt EM. Alcoholic and nonalcoholic steatohepatitis. Clin Liver Dis. 2002;6:399–420. vii. - PubMed

Publication types

MeSH terms