. 2011 Jul;59(1):40-54.
doi: 10.1111/j.1365-2559.2011.03878.x.

Cell-based quantification of molecular biomarkers in histopathology specimens

Affiliations

Cell-based quantification of molecular biomarkers in histopathology specimens

Yousef Al-Kofahi et al. Histopathology. 2011 Jul.

Abstract

Aims: To investigate the use of a computer-assisted technology for objective, cell-based quantification of molecular biomarkers in specified cell types in histopathology specimens, with the aim of advancing current visual estimation and pixel-level (rather than cell-based) quantification methods.

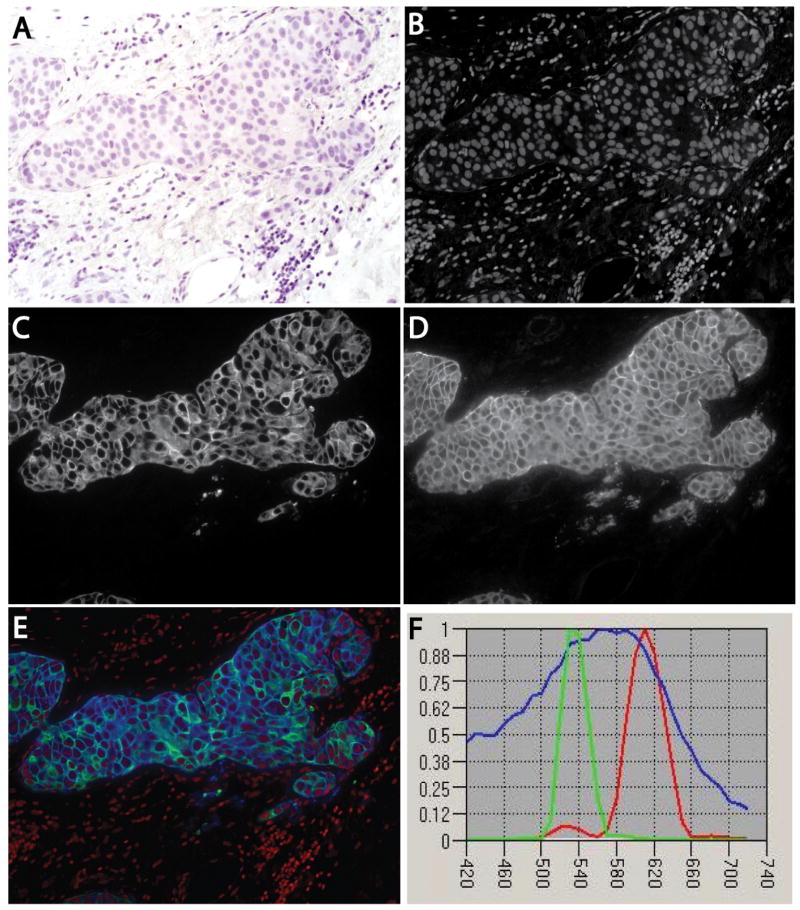
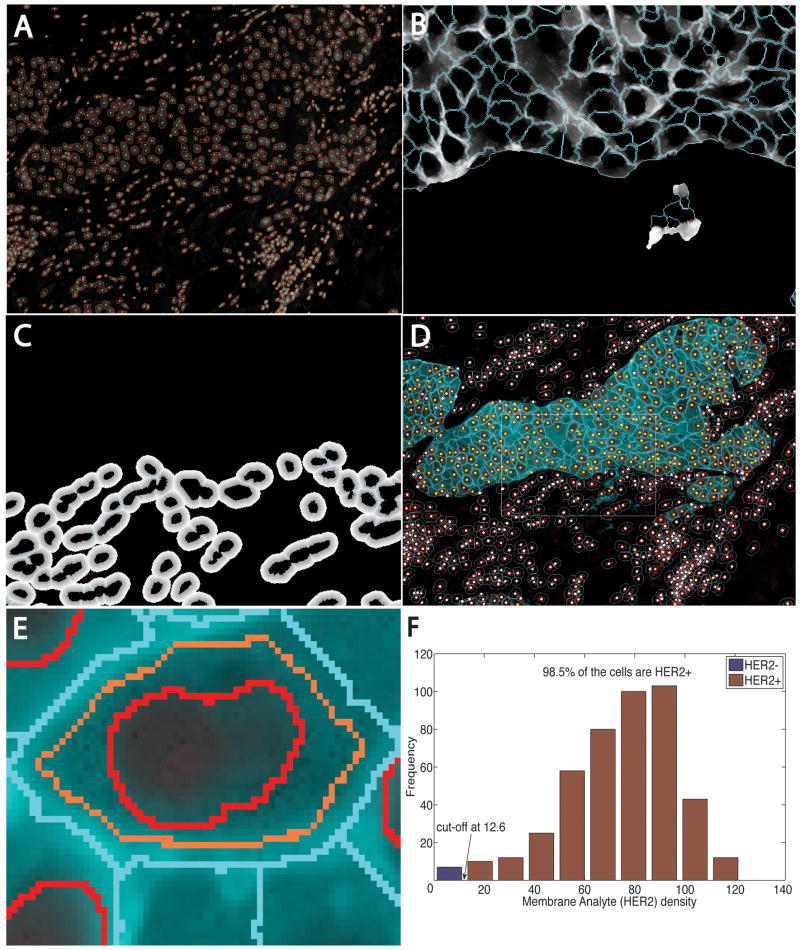
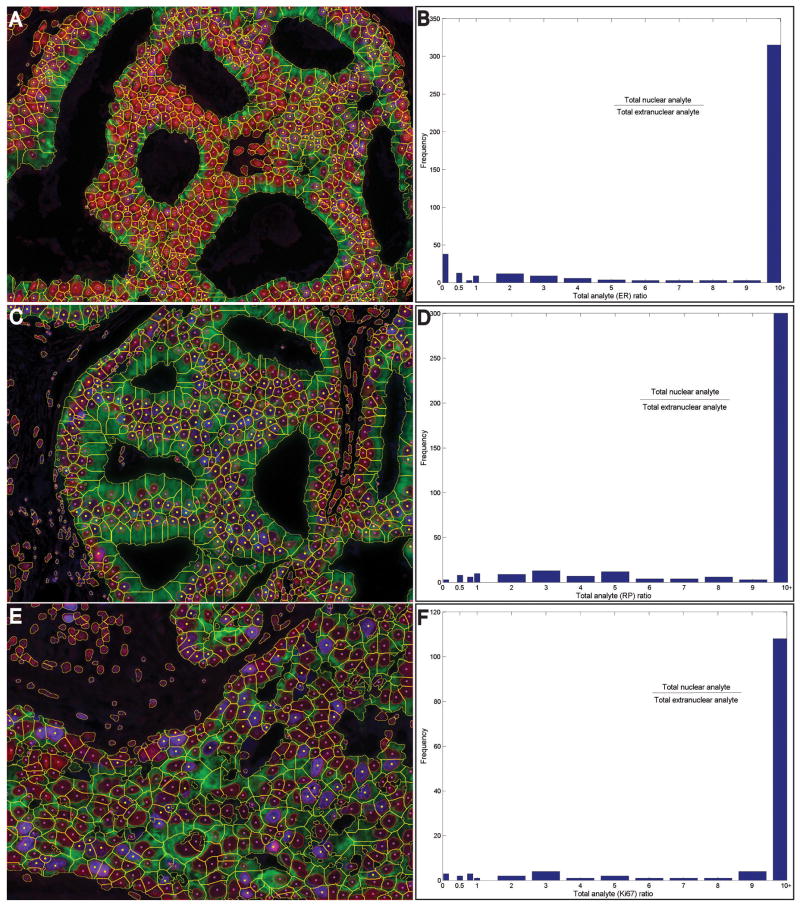
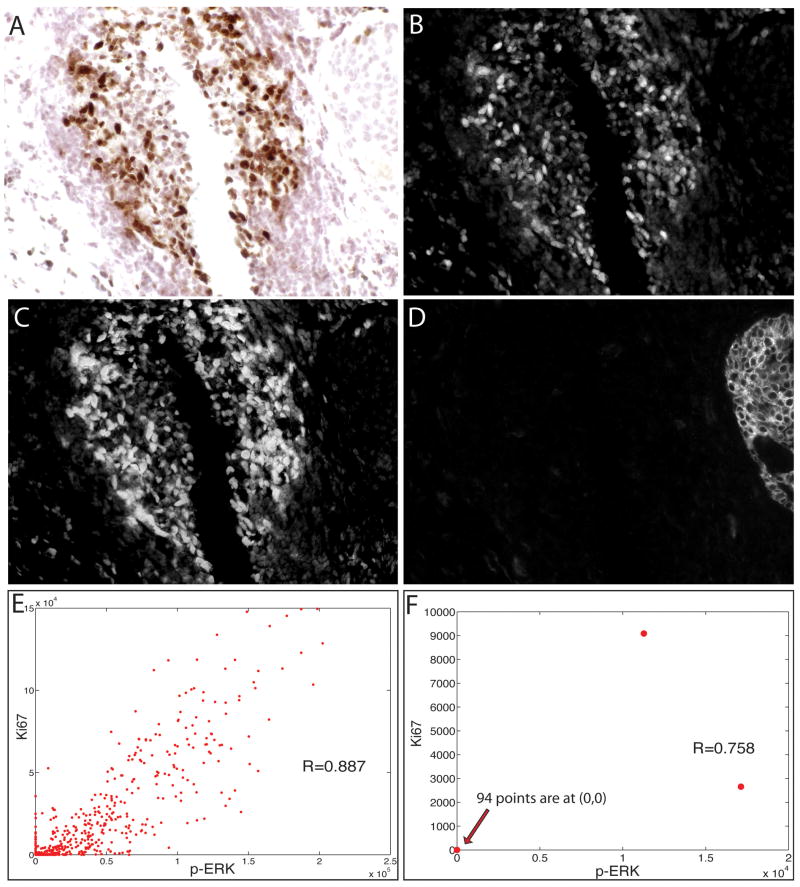
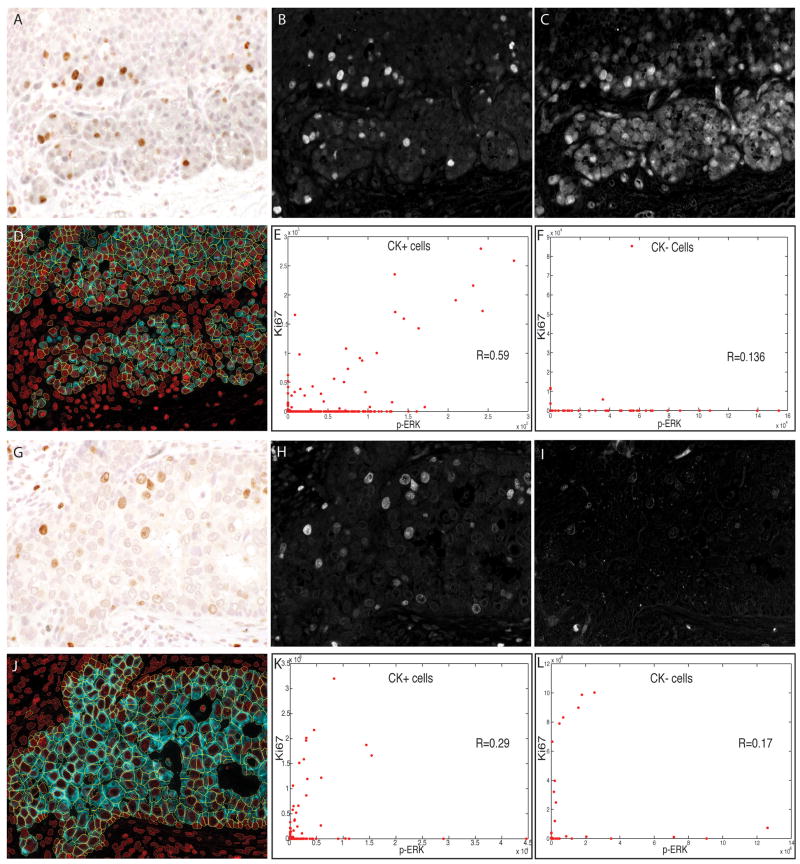
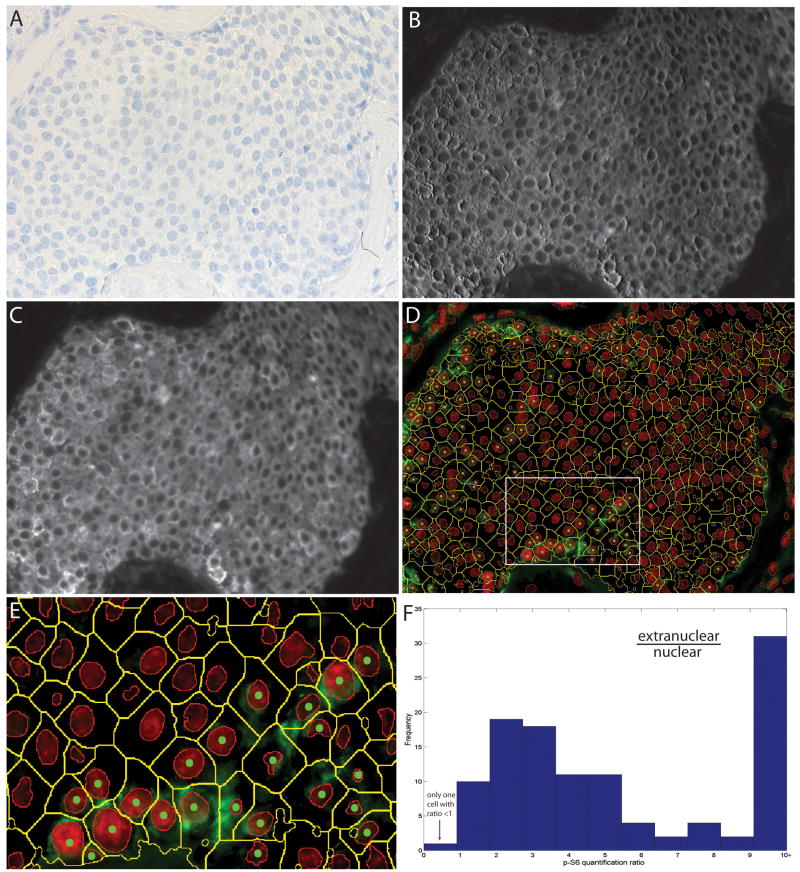
Methods and results: Tissue specimens were multiplex-immunostained to reveal cell structures, cell type markers, and analytes, and imaged with multispectral microscopy. The image data were processed with novel software that automatically delineates and types each cell in the field, measures morphological features, and quantifies analytes in different subcellular compartments of specified cells.The methodology was validated with the use of cell blocks composed of differentially labelled cultured cells mixed in known proportions, and evaluated on human breast carcinoma specimens for quantifying human epidermal growth factor receptor 2, estrogen receptor, progesterone receptor, Ki67, phospho-extracellular signal-related kinase, and phospho-S6. Automated cell-level analyses closely matched human assessments, but, predictably, differed from pixel-level analyses of the same images.

Conclusions: Our method reveals the type, distribution, morphology and biomarker state of each cell in the field, and allows multiple biomarkers to be quantified over specified cell types, regardless of their abundance. It is ideal for studying specimens from patients in clinical trials of targeted therapeutic agents, for investigating minority stromal cell subpopulations, and for phenotypic characterization to personalize therapy and prognosis.


Figures

Figure 1
Figure 1
Multiplex-stained human breast cancer specimen. A human breast cancer was stained for HER2 by immunofluorescence with Texas Red and for cytokeratin by immunofluorescence with Alexa-488, and counterstained with haematoxylin. The slide was imaged multispectrally in absorption and fluorescence modes, and the results were unmixed to yield non-overlapping channels. A, Brightfield image showing haematoxylin staining. B, Unmixed channel containing only cell nuclei, corresponding to the haematoxylin spectral signature. C, Unmixed channel for fluorescently stained cytokeratin. D, Unmixed channel corresponding to fluorescently stained HER2. E, Composite three-colour image with nuclei (red), cytokeratin (green), and HER2 (blue). F, Spectral signatures used for the unmixing computations, displayed using blue for haematoxylin (nuclei), green for Alexa-488 (cytokeratin), and red for Texas Red (HER2).
Figure 2
Figure 2
Automated image analysis steps for the specimen in Figure 1. A, Automatic nuclear segmentation (red outlines) of the nuclear channel. B, Estimated cytoplasmic domains for cytokeratin-positive cells for the boxed region in D overlaid on the gradient-enhanced distance map (Mode 0). C, Geometrically estimated cytoplasmic domains for stromal cells in the same region overlaid on the underlying dominance map (Mode 1). D, Composite cell segmentation and classification results, with yellow dots indicating cells that are cytokeratin-positive and HER2-positive, and white dots indicating other cells. E, Close-up illustrating regions of interest used to quantify HER2. F, Histogram summary showing the cut-off point for declaring cells HER2-positive.
Figure 3
Figure 3
Examples showing analysis of breast cancer specimens stained for three nuclear-bound biomarkers. Breast cancer slides were immunostained for oestrogen receptor (A,B), progesterone receptor (C,D), or Ki67 (E,F) plus cytokeratin, and counterstained with haematoxylin. Images were captured, and nuclear and whole-cell segmentation was performed, with yellow dots indicating the nuclei positive for the respective analytes (A,C,E). Analyte was quantified in the nuclear and extranuclear compartments of each cell, and histograms of the nuclear/extranuclear analyte level ratios in all positive cells are shown (B,D,F).
Figure 4
Figure 4
Duplex analysis of phospho-extracellular signal-related kinase (p-ERK) and Ki67 immunostaining in lymphoid cells in a human breast carcinoma. A section of a breast tumour was stained sequentially with anti-p-ERK (SG Blue), anti-Ki67 [3,3-diaminobenzidine (DAB)] and anti-CK (Alexa-488) antibodies, and this was followed by haematoxylin staining, multispectral imaging (×400), and cytometric analysis. The brightfield image of a lymphoid nodule in the tumour is shown (A), along with the unmixed channels for DAB (Ki67) (B), SG Blue (p-ERK) (C), and Alexa-488 (cytokeratin) (D). Scatter plots of p-ERK (x-axis) and Ki67 (y-axis) staining intensity are shown for cells in the lymphoid nodule (E) and for tumour cells (F), with each dot representing one cell.
Figure 5
Figure 5
Duplex analysis of phospho-extracellular signal-related kinase (p-ERK) and Ki67 immunostaining in human breast carcinoma cells. Sections of two different breast tumours were stained and analysed as described for Figure 5. Brightfield images of the two different tumours are shown (A,G), with the unmixed channels for 3,3-diaminobenzidine (Ki67) (B,H) and SG Blue (p-ERK) (C,I). Composite images showing whole-cell segmentation of the tumour (cytokeratin-positive) cells are shown (D,J). Scatter plots of p-ERK (x-axis) and Ki67 (y-axis) staining intensity are shown for tumour cells (E,K) and for non-tumour (stromal) cells (F,L), with each dot representing one cell.
Figure 6
Figure 6
Analysis of phospho-S6 immunostaining in a human breast cancer. A section of a breast tumour was stained with anti-p-S6 (Alexa-488), anti-epithelial membrane antigen (EMA) (Alexa-594) and anti-cytokeratin (CK) (Alexa-555), and this was followed by haematoxylin staining, multispectral imaging (×400), and cytometric analysis. The brightfield image is shown (A), along with unmixed channels for Alexa-555 (CK) (B) and Alexa-594 (EMA) (C). Composite images of p-S6 analyte staining along with segmented whole tumour cells are shown (D; E shows an enlargement of the boxed area in D). In each cell, analyte in the nuclear and extranuclear compartment was quantified. Extranuclear/nuclear analyte ratios were calculated for each positive tumour cell, and their distribution is shown (F).

Similar articles

Cited by

References

    1. Cheng J, Qiu S, Raju U, Wolman SR, Worsham MJ. Benign breast disease heterogeneity: association with histopathology, age, and ethnicity. Breast Cancer Res Treat. 2008;111:289–296. - PMC - PubMed
    1. Hammerschmied CG, Walter B, Hartmann A. Renal cell carcinoma 2008: histopathology, molecular genetics and new therapeutic options. Pathologe. 2008;29:354–363. - PubMed
    1. Crocker J, Murray P. Molecular biology in cellular pathology. Chichester: Wiley; 2003.
    1. Research Signpost (Trivandrum India) Recent research developments in histopathology. Trivandrum, India: Research Signpost; 2002. v.
    1. Menard S, Balsari A, Tagliabue E, et al. Biology, prognosis and response to therapy of breast carcinomas according to HER2 score. Ann Oncol. 2008;19:1706–1712. - PubMed

Publication types

MeSH terms