. 2011 Jul 19;12(7):R65.
doi: 10.1186/gb-2011-12-7-r65.

Proteome-wide evidence for enhanced positive Darwinian selection within intrinsically disordered regions in proteins

Affiliations

Proteome-wide evidence for enhanced positive Darwinian selection within intrinsically disordered regions in proteins

Johan Nilsson et al. Genome Biol. .

Abstract

Background: Understanding the adaptive changes that alter the function of proteins during evolution is an important question for biology and medicine. The increasing number of completely sequenced genomes from closely related organisms, as well as individuals within species, facilitates systematic detection of recent selection events by means of comparative genomics.

Results: We have used genome-wide strain-specific single nucleotide polymorphism data from 64 strains of budding yeast (Saccharomyces cerevisiae or Saccharomyces paradoxus) to determine whether adaptive positive selection is correlated with protein regions showing propensity for different classes of structure conformation. Data from phylogenetic and population genetic analysis of 3,746 gene alignments consistently shows a significantly higher degree of positive Darwinian selection in intrinsically disordered regions of proteins compared to regions of alpha helix, beta sheet or tertiary structure. Evidence of positive selection is significantly enriched in classes of proteins whose functions and molecular mechanisms can be coupled to adaptive processes and these classes tend to have a higher average content of intrinsically unstructured protein regions.

Conclusions: We suggest that intrinsically disordered protein regions may be important for the production and maintenance of genetic variation with adaptive potential and that they may thus be of central significance for the evolvability of the organism or cell in which they occur.


Figures

Figure 1
Figure 1
Flow chart illustrating the initial processing of the source data. The diagram show the steps involved in creating multiple alignments including S. cerevisiae and S. paradoxus strains as well as the number of genes involved at each step. Filtering steps for removal of uncertain alignments are also shown. See Materials and methods for details.
Figure 2
Figure 2
Codon sites under positive selection are over-represented in gene regions encoding intrinsically disordered regions of proteins. (a) The ratio of positive to negative sites is higher in IDRs than in regions of regular protein structure. The ratio of positive to negative sites is shown for protein regions predicted to have α-helical (α), β-sheet (β) or intrinsically disordered (IDR) protein conformation. The P-value shows the significance of the difference between the ratio associated with IDRs in relation to regions of regular structure (a χ2 test was used to test the null hypothesis that there is no difference between the ratios associated with different protein conformation classes). (b) The proportion of codons under selection is enhanced in IDRs for positively selected sites but not negatively selected sites. Annotations are as for (a). Differences between the frequencies of negative sites in regions of different protein conformation were not significant. (c) The ratio of positive to negative sites is higher in long IDRs than in structured protein domains. The ratio of positive to negative sites is shown for protein regions within known protein domains (PDB dom) or predicted intrinsically disordered protein regions of at least 30 residues in length (IDR ≥30). The frequency of positively selected codons in IDR ≥30 and PDB dom is 0.0055 and 0.0011, respectively, while the equivalent frequencies for negatively selected codons are 0.0728 and 0.0750, respectively. (d) Codons under positive selection are significantly more frequent in IDRs than expected in relation to an empirically generated random distribution of selected sites. The panels show empirical frequency distributions (histograms) predicted for a random distribution of positively and negatively selected sites within protein regions with intrinsically disordered structure (IDR), β-sheet and α-helix conformation, generated by 10,000 randomization trials. The median of each distribution is shown associated with upward-pointing arrowheads and the observed number of selected sites together with downward-pointing arrowheads. The ratio of the observed number of sites in relation to the median of the random distribution is shown in the upper right corner of each panel. The ratio is significantly different from unity in all cases (P ≤ 10-3) except for negative sites in α-helical regions.
Figure 3
Figure 3
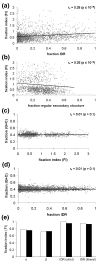
Relative levels of species-specific fixation of variant SNP alleles in each gene are correlated with the level of intrinsically disordered region content in the corresponding proteins. (a, b) Scatter plot showing the fixation index (FI) for genes, calculated by the McDonald-Kreitman test (see Materials and methods), is positively correlated with the fraction of IDR (a) and negatively correlated with the fraction of regular secondary structure (b) in the corresponding proteins. Spearman's rank correlation coefficients (rS) and associated P-values are shown. (c, d) The (G+C) content of genes is not correlated with their FI (c) or with the fraction of IDR in the corresponding proteins (d). Spearman's rank correlation coefficients (rS) and associated P-values are shown. (e) The mean FI corresponding to all IDRs studied is higher than that for all α-helical regions or β-sheet regions studied. The FI for concatenated tracts of predicted α-helical (α), β-sheet (β) and IDRs are plotted. Values are shown for IDR predictions using confidence thresholds of 0.8 (strict) or 0.5 (liberal) (see Materials and methods for details). Open bars designate results obtained for the non-filtered data set while the filled bars designate the data set after removal of outliers (see Materials and methods for details).
Figure 4
Figure 4
Functional amino acid residues are not under-represented in intrinsically disordered regions within proteins. The Limacs functional sites index calculated for mapped Pfam domains within IDRs is plotted against different confidence value thresholds used for prediction of IDRs. The mean fraction of residues predicted to be in IDRs relative to structured regions, at different prediction threshold values, is indicated by open diamonds (default threshold used in the study was 0.8). The corresponding Limacs functional sites index is shown without filtering (filled squares) or after filtering to remove multiple examples of the same Pfam domain (filled circles; see Materials and methods for details).
Figure 5
Figure 5
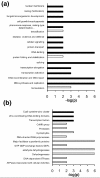
Specific protein categories are significantly over-represented in their content of codon sites under positive or negative selection. (a) Functional categories of the MIPS FunCat proteins that show significant (P ≤ 0.01) enrichment of codon sites under positive (filled bars) or negative (open bars) selection. (b) Functional categories of the MIPS ProteinCat proteins that show significant (P ≤ 0.01) enrichment of codon sites under positive (filled bars) or negative (open bars) selection.
Figure 6
Figure 6
Protein categories enriched in codon sites under positive selection tend to have higher average levels of intrinsically disordered regions compared to categories enriched in sites under negative selection. (a) MIPS FunCat categories are plotted in a rank according to their IDR content (small open circles). Categories from Figure 5a that are enriched in codon sites under positive (filled squares) or negative (open triangles) selection are plotted with a larger symbol. (b) MIPS ProteinCat classes, including those enriched in codon sites under selection (Figure 5b), are plotted as in (a).

Similar articles

Cited by

References

    1. Kimura M. Evolutionary rate at the molecular level. Nature. 1968;217:624–626. doi: 10.1038/217624a0. - DOI - PubMed
    1. MacCallum C, Hill E. Being positive about selection. PLoS Biol. 2006;4:e87. doi: 10.1371/journal.pbio.0040087. - DOI - PMC - PubMed
    1. Sabeti P, Reich D, Higgins J, Levine H, Richter D, Schaffner S, Gabriel S, Platko J, Patterson N, McDonald G, Ackerman H, Campbell S, Altshuler D, Cooper R, Kwiatkowski D, Ward R, Lander E. Detecting recent positive selection in the human genome from haplotype structure. Nature. 2002;419:832–837. doi: 10.1038/nature01140. - DOI - PubMed
    1. Tang K, Thornton K, Stoneking M. A new approach for using genome scans to detect recent positive selection in the human genome. PLoS Biol. 2007;5:e171. doi: 10.1371/journal.pbio.0050171. - DOI - PMC - PubMed
    1. Yang Z. PAML 4: phylogenetic analysis by maximum likelihood. Mol Biol Evol. 2007;24:1586–1591. doi: 10.1093/molbev/msm088. - DOI - PubMed

Publication types