Review
. 2011 Jun 28;11(1):76-90.
doi: 10.1102/1470-7330.2011.0014.

Breast MR with special focus on DW-MRI and DCE-MRI

Affiliations
Review

Breast MR with special focus on DW-MRI and DCE-MRI

G Petralia et al. Cancer Imaging. .

Abstract

The use of magnetic resonance imaging (MRI) for the assessment of breast lesions was first described in the 1970s; however, its wide application in clinical routine is relatively recent. The basic principles for diagnosis of a breast lesion rely on the evaluation of signal intensity in T2-weighted sequences, on morphologic assessment and on the evaluation of contrast enhancement behaviour. The quantification of dynamic contrast behaviour by dynamic contrast-enhanced (DCE) MRI and evaluation of the diffusivity of water molecules by means of diffusion-weighted MRI (DW-MRI) have shown promise in the work-up of breast lesions. Therefore, breast MRI has gained a role for all indications that could benefit from its high sensitivity, such as detection of multifocal lesions, detection of contralateral carcinoma and in patients with familial disposition. Breast MRI has been shown to have a role in monitoring of neoadjuvant chemotherapy, for the evaluation of therapeutic results during the course of therapy. Breast MRI can improve the determination of the remaining tumour size at the end of therapy in patients with a minor response. DCE-MRI and DW-MRI have shown potential for improving the early assessment of tumour response to therapy and the assessment of residual tumour after the end of therapy. Breast MRI is important in the postoperative work-up of breast cancers. High sensitivity and specificity have been reported for the diagnosis of recurrence; however, pitfalls such as liponecrosis and changes after radiation therapy have to be carefully considered.


Figures

Figure 1
Figure 1
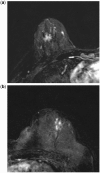
Axial T2-weighted STIR image of the left breast showing a breast carcinoma with peri-focal oedema (arrows).
Figure 2
Figure 2
Axial subtracted image showing mass-enhancing lesions, with (a) round, (b) oval, (c) lobulated, and (d) irregular shape.
Figure 3
Figure 3
Axial subtracted image showing mass-enhancing lesion of the right breast with spiculated margins.
Figure 4
Figure 4
Axial subtracted image showing mass-enhancing lesion of the left breast with rim enhancement.
Figure 5
Figure 5
Axial subtracted image showing non-masslike lesion of the right breast with a clumped internal enhancement pattern referring to a cobblestonelike pattern with occasional confluent areas.
Figure 6
Figure 6
Signal intensity–time curve describing the dynamic contrast behaviour of the lesion of interest.
Figure 7
Figure 7
Potential pitfalls: (a) axial subtracted image of the right breast showing an 8-mm mass-enhancing lesion, with oval shape, well-defined margins and slightly heterogeneous contrast enhancement. (b) Axial T2-weighted STIR image shows an 8.7-mm hyperintense lesion of the left breast (arrowhead) with oval shape. (c) A second-look ultrasound examination showed the presence of an oval-shaped lymph node with well-defined margins and a hyperechoic central hilar structure, typical of benign lymph nodes.
Figure 8
Figure 8
Potential pitfalls: (a) axial subtracted image of the right breast showing a 13-mm mass-enhancing lesion with irregular shape and margins. Similar contrast enhancement morphology is seen in another lesion in a different patient (b). Based on the morphologic characteristics of contrast enhancement, the most likely diagnosis would be malignancy. However, in this case the signal intensity–time curve showed rapid initial enhancement, and a mild continuous increase in the delayed phase for the lesion in (a), but rapid initial enhancement and washout in the delayed phase for the lesion in (b), indicating focal fibrocystic change and disease recurrence, respectively.
Figure 9
Figure 9
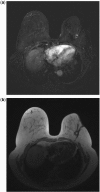
(a) Axial subtracted image in a patient previously surgically treated for breast cancer, showing irregular contrast enhancement in the proximity of the surgical scar making the differential diagnosis between recurrent disease and fat necrosis difficult. (b) Axial T1-weighted MR image of the same breast, showing the predominantly fat content of the suspected lesion pointing towards the diagnosis of fat necrosis.
Figure 10
Figure 10
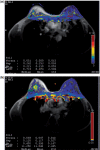
Pixel-by-pixel colour maps with each pixel representing values for Ktrans (other maps can be generated for Kep, Ve, iAUC60). The tabulated values are derived from the ROIs drawn on subtracted images and copied to the colour maps for each parameter. In this example, ROI 1 is for breast cancer (a) and ROI 2 is for fibroadenoma (b).
Figure 11
Figure 11
A 16-mm mass lesion of the right breast, which is hyperintense in (a), the axial high b-value (1000 s/mm2) DW-MR image, and dark on (b), ADC maps representing low ADC values (impeded diffusion), characteristic of breast cancer.
Figure 12
Figure 12
Cyst showing bright colour on the ADC map indicating high ADC values (free diffusion).
Figure 13
Figure 13
Top two images showing axial high b-value (1000 s/mm2) DW-MR image (top left) with corresponding ADC map (top right): an ROI has been drawn on the DW-MR image (b = 1000 s/mm2) and copied on the corresponding ADC maps for delineating a breast carcinoma of the left breast. The bottom two images showing axial high b-value (b = 1000 s/mm2) DW-MR image (bottom left) with corresponding ADC map (bottom right) of the same tumour after one cycle of neoadjuvant chemotherapy showing an increase in mean ADC values (circled values) from 995 to 1145 × 10−6 mm2/s.
Figure 14
Figure 14
(a) Axial subtracted image at baseline shows a mass-enhancing lesion of the left breast (arrow) with irregular shape and margins, characterized by heterogeneous contrast enhancement. (b) Axial high b-value (b = 1000 s/mm2) DW-MR image of the same lesion (arrow), appearing hyperintense, characteristic of breast cancer. (c) The axial subtracted image after completion of neoadjuvant chemotherapy does not clearly allow exact identification of the extent of residual tumour (arrow), if any, due to the mild contrast enhancement. (d) The axial high b-value (b = 1000 s/mm2) DW-MR image of the same lesion (arrow) shows a discrete hyperintense lesion, more clearly distinguishable from the surrounding breast tissue, accounting for residual disease, which was then confirmed after surgery.

References

    1. BI-RADS® Atlas. American College of Radiology. http://www.acr.org/SecondaryMainMenuCategories/quality_safety/BIRADSAtla.... Accessed 20th February 2011.
    1. Padhani AR, Liu G, Koh DM, et al. Diffusion-weighted magnetic resonance imaging as a cancer biomarker: consensus and recommendations. Neoplasia. 2009;11:102–25. - PMC - PubMed
    1. Sinha S, Lucas-Quesada FA, Sinha U, DeBruhl N, Bassett LW. In vivo diffusion-weighted MRI of the breast: potential for lesion characterization. J Magn Reson Imaging. 2002;15:693–704. doi: 10.1002/jmri.10116. - DOI - PubMed
    1. Sardanelli F, Boetes C, Borisch B, et al. Magnetic resonance imaging of the breast: recommendations from the EUSOMA working group. Eur J Cancer. 2010;46:1296–316. doi: 10.1016/j.ejca.2010.02.015. - DOI - PubMed
    1. Sardanelli F, Fausto A, Menicagli L, Esseridou A. Breast vascular mapping obtained with contrast-enhanced MR imaging: implications for cancer diagnosis, treatment, and risk stratification. Eur Radiol. 2007;17(Suppl 6):F48–51. - PubMed

LinkOut - more resources