Novel genetic variants in the chromosome 5p15.33 region associate with lung cancer risk
- PMID: 21771723
- PMCID: PMC3179422
- DOI: 10.1093/carcin/bgr136
Novel genetic variants in the chromosome 5p15.33 region associate with lung cancer risk
Abstract
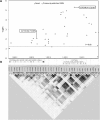
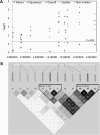
Chromosome 5p15.33 has been identified by genome-wide association studies as one of the regions that associate with lung cancer risk. A few single-nucleotide polymorphisms (SNPs) in the telomerase reverse transcriptase (TERT) and cleft lip and palate transmembrane 1-like (CLPTM1L) genes located in this region have shown consistent associations. We performed dense genotyping of SNPs in this region to refine the previously reported association signals for lung cancer risk. Two hundred and fifteen SNPs were genotyped on an Illumina iSelect panel, in a hospital-based case-control study of 1681 lung cancer cases and 1235 unaffected controls. Association was tested using unconditional logistic regression, while adjusting for age, sex and pack-years smoked. Furthermore, since many of the SNPs were in linkage disequilibrium (LD), haplotype blocks were constructed, from which tagging SNPs at an r(2) threshold of ≥0.95 were included in a stepwise forward selection logistic regression model. Of the 215 SNPs, 69 were significant at P < 0.05 in univariate analysis; of these, 35 SNPs meeting the r(2) threshold were included in the multiple logistic regression model. Two SNPs, rs370348 (odds ratio = 0.76, P = 1.6 × 10(-6)) and rs4975538 (odds ratio = 1.18, P = 0.005), significantly associated with risk in the overall sample. Among ever smokers, rs4975615 (odds ratio = 0.75, P = 1.2 × 10(-4)) and rs4975538 (odds ratio = 1.26, P = 0.002) were significant, whereas among never-smokers, rs451360 (odds ratio = 0.62, P = 7.6 × 10(-5)) was significant. We refined the consistent association signal in this region, allowing for the considerable LD between SNPs and identified four novel SNPs that were independently and significantly associated with lung cancer risk. Results of these analyses strongly suggest effects on risk from several loci in the TERT/CLPTM1L region.
Figures


Similar articles
-
Role of 5p15.33 (TERT-CLPTM1L), 6p21.33 and 15q25.1 (CHRNA5-CHRNA3) variation and lung cancer risk in never-smokers.Carcinogenesis. 2010 Feb;31(2):234-8. doi: 10.1093/carcin/bgp287. Epub 2009 Dec 2. Carcinogenesis. 2010. PMID: 19955392
-
Genetic variant rs401681 at 5p15.33 modifies susceptibility to lung cancer but not esophageal squamous cell carcinoma.PLoS One. 2013 Dec 30;8(12):e84277. doi: 10.1371/journal.pone.0084277. eCollection 2013. PLoS One. 2013. PMID: 24386361 Free PMC article.
-
Association of genetic polymorphisms in TERT-CLPTM1L with lung cancer in a Chinese population.Genet Mol Res. 2015 May 4;14(2):4469-76. doi: 10.4238/2015.May.4.4. Genet Mol Res. 2015. PMID: 25966219
-
Association of rs401681 (C > T) and rs402710 (C > T) polymorphisms in the CLPTM1L region with risk of lung cancer: a systematic review and meta-analysis.Sci Rep. 2024 Sep 30;14(1):22603. doi: 10.1038/s41598-024-73254-6. Sci Rep. 2024. PMID: 39349641 Free PMC article.
-
The OncoArray Consortium: A Network for Understanding the Genetic Architecture of Common Cancers.Cancer Epidemiol Biomarkers Prev. 2017 Jan;26(1):126-135. doi: 10.1158/1055-9965.EPI-16-0106. Epub 2016 Oct 3. Cancer Epidemiol Biomarkers Prev. 2017. PMID: 27697780 Free PMC article. Review.
Cited by
-
TERT rs2736100 polymorphism contributes to lung cancer risk: a meta-analysis including 49,869 cases and 73,464 controls.Tumour Biol. 2014 Jun;35(6):5569-74. doi: 10.1007/s13277-014-1734-2. Epub 2014 Feb 18. Tumour Biol. 2014. PMID: 24535778
-
Polymorphisms of the centrosomal gene (FGFR1OP) and lung cancer risk: a meta-analysis of 14,463 cases and 44,188 controls.Carcinogenesis. 2016 Mar;37(3):280-289. doi: 10.1093/carcin/bgw014. Epub 2016 Feb 10. Carcinogenesis. 2016. PMID: 26905588 Free PMC article.
-
The MNS16A VNTR polymorphism of the TERT gene in bladder cancer.Turk J Urol. 2019 Nov 29;46(1):44-49. doi: 10.5152/tud.2019.19005. Print 2020 Jan. Turk J Urol. 2019. PMID: 31905123 Free PMC article.
-
Quantitative assessment of common genetic variants on chromosome 5p15 and lung cancer risk.Tumour Biol. 2014 Jun;35(6):6055-63. doi: 10.1007/s13277-014-1802-7. Epub 2014 Mar 12. Tumour Biol. 2014. PMID: 24615522
-
The association between ATM IVS 22-77 T>C and cancer risk: a meta-analysis.PLoS One. 2012;7(1):e29479. doi: 10.1371/journal.pone.0029479. Epub 2012 Jan 19. PLoS One. 2012. PMID: 22276117 Free PMC article.
References
Publication types
MeSH terms
Substances
Grants and funding
LinkOut - more resources
Full Text Sources
Other Literature Sources
Medical
Research Materials

