. 2011 Sep;21(9):1498-505.
doi: 10.1101/gr.123638.111. Epub 2011 Jul 19.

Accurate and comprehensive sequencing of personal genomes

Affiliations

Accurate and comprehensive sequencing of personal genomes

Subramanian S Ajay et al. Genome Res. 2011 Sep.

Abstract

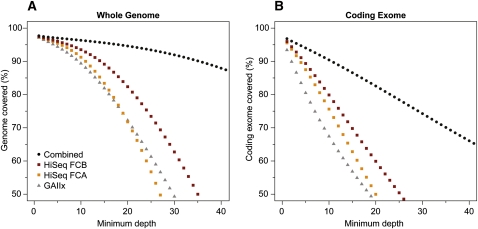
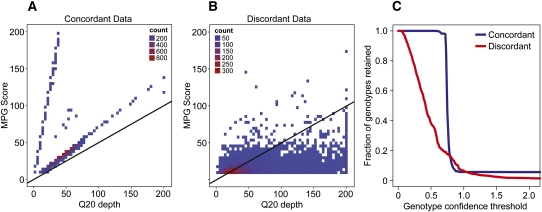
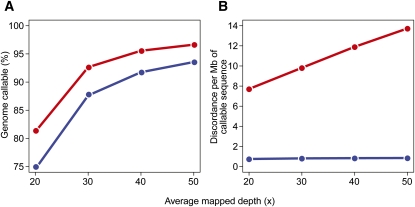
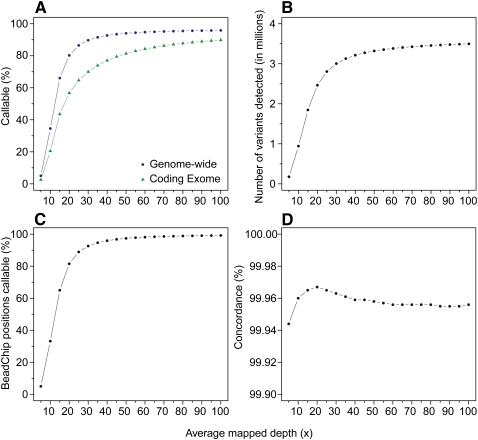
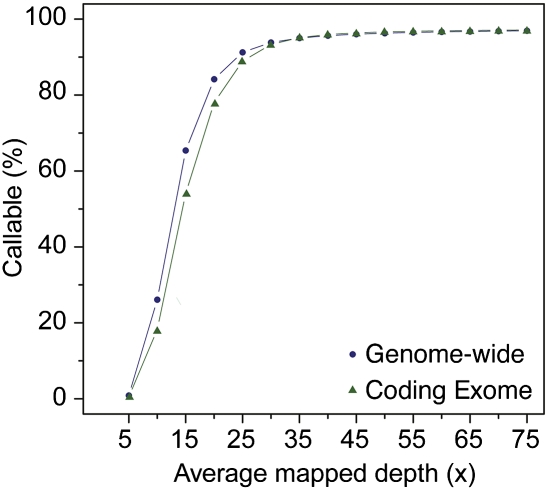
As whole-genome sequencing becomes commoditized and we begin to sequence and analyze personal genomes for clinical and diagnostic purposes, it is necessary to understand what constitutes a complete sequencing experiment for determining genotypes and detecting single-nucleotide variants. Here, we show that the current recommendation of ∼30× coverage is not adequate to produce genotype calls across a large fraction of the genome with acceptably low error rates. Our results are based on analyses of a clinical sample sequenced on two related Illumina platforms, GAII(x) and HiSeq 2000, to a very high depth (126×). We used these data to establish genotype-calling filters that dramatically increase accuracy. We also empirically determined how the callable portion of the genome varies as a function of the amount of sequence data used. These results help provide a "sequencing guide" for future whole-genome sequencing decisions and metrics by which coverage statistics should be reported.


Figures

Figure 1.
Figure 1.
Breadth versus depth of whole-genome coverage. The x-axis represents the minimum number of high-quality bases (≥Q20) from high-quality alignments (≥MapQ30), and the y-axis represents the proportion of genome (A) or coding exome (B) covered at that depth. To calculate percentages, the total size of hg18 build and the total number of non-redundant coding bases from the UCSC Known Genes table (2,852,680,119 bp and 34,068,542 bp, respectively) were used. Gaps and pseudo-autosomal regions (PAR) were excluded. Values were plotted for GAIIx (triangle), HiSeq flowcell A (orange square), HiSeq 2000 flowcell B (dark red square), and all data sets combined (circle).
Figure 2.
Figure 2.
Effect of alignment filter on the discordance rate of identical genomes. The number of discordant positions (y-axis) was observed by varying MapQ values (x-axis). A MapQ value of 0 indicates that no mapping quality filter was applied.
Figure 3.
Figure 3.
Determination of genotype confidence threshold for genotype calls. (A,B) The x-axes represent Q20 depth for genotype calls from one of the 50× genomes, and the y-axes represent corresponding MPG scores. (A) A random set of ∼8700 concordant genotypes; (B) 8710 discordant genotypes. Black lines represent a line with slope of 0.5, which is the confidence threshold used to filter genotypes. (C) The fraction of genotypes retained by varying the confidence threshold; (blue curve) the fraction of concordant genotypes retained; (red curve) the fraction of discordant genotypes retained.
Figure 4.
Figure 4.
Comparison of identical genomes at various mapped depths. (A,B) The x-axes represent the average mapped depths at which two identical genomes were compared. The y-axes represent the proportion of hg18 callable in both genomes (A) and the discordance per megabase of callable sequence (B). Analyses were done on all unique alignments (MapQ > 0) without applying any filters (red curve) and after applying mapping quality and genotype confidence filters as explained in the text (blue curve).
Figure 5.
Figure 5.
Genotype calling as a function of average mapped depth. The x-axes represent the average mapped depth of each data set, and the y-axes represent the proportion of the whole genome (dark blue circles) and coding exome (green triangles) that is callable (A), the number of SNVs detected (B), the proportion of Illumina BeadChip positions callable (C), and the concordance rates with the BeadChip calls (D).
Figure 6.
Figure 6.
Improved representation of genome with TruSeq v3 sequencing chemistry and software. The x-axis represents the average mapped depth of the data set, and the y-axis represents the proportion of the whole genome (dark blue circles) and coding exome (green triangles) that is callable.

References

    1. 1000 Genome Project Consortium 2010. A map of human genome variation from population-scale sequencing. Nature 467: 1061–1073 - PMC - PubMed
    1. Aird D, Ross MG, Chen W-S, Danielsson M, Fennell T, Russ C, Jaffe DB, Nusbaum C, Gnirke A 2011. Analyzing and minimizing PCR amplification bias in Illumina sequencing libraries. Genome Biol 12: R18 doi: 10.1186/gb-2011-12-2-r18 - PMC - PubMed
    1. Bentley DR, Balasubramanian S, Swerdlow HP, Smith GP, Milton J, Brown CG, Hall KP, Evers DJ, Barnes CL, Bignell HR, et al. 2008. Accurate whole human genome sequencing using reversible terminator chemistry. Nature 456: 53–59 - PMC - PubMed
    1. Campbell PJ, Stephens PJ, Pleasance ED, O'Meara S, Li H, Santarius T, Stebbings LA, Leroy C, Edkins S, Hardy C, et al. 2008. Identification of somatically acquired rearrangements in cancer using genome-wide massively parallel paired-end sequencing. Nat Genet 40: 722–729 - PMC - PubMed
    1. Chen W, Kalscheuer V, Tzschach A, Menzel C, Ullmann R, Schulz MH, Erdogan F, Li N, Kijas Z, Arkesteijn G, et al. 2008. Mapping translocation breakpoints by next-generation sequencing. Genome Res 18: 1143–1149 - PMC - PubMed

Publication types