. 2011 Sep 9;286(36):31885-95.
doi: 10.1074/jbc.M111.245605. Epub 2011 Jul 19.

Identification of the cluster control region for the protocadherin-beta genes located beyond the protocadherin-gamma cluster

Affiliations

Identification of the cluster control region for the protocadherin-beta genes located beyond the protocadherin-gamma cluster

Shinnichi Yokota et al. J Biol Chem. .

Abstract

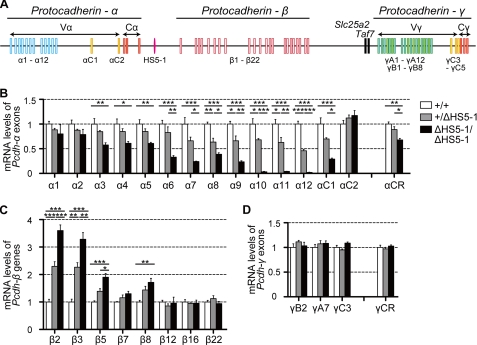
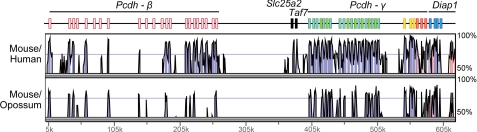
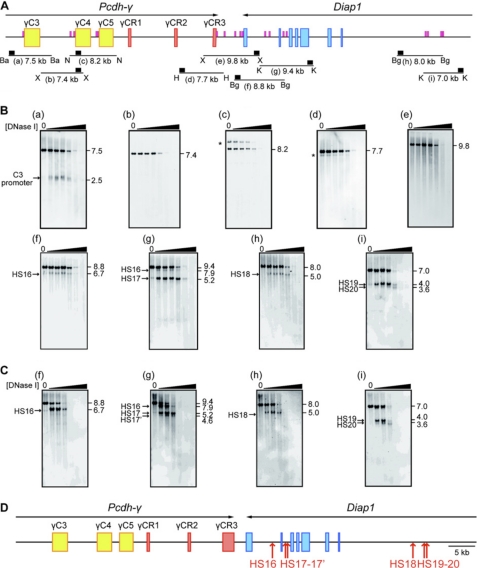
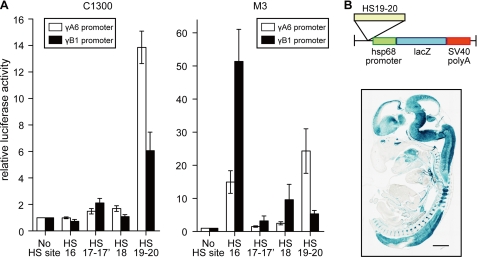
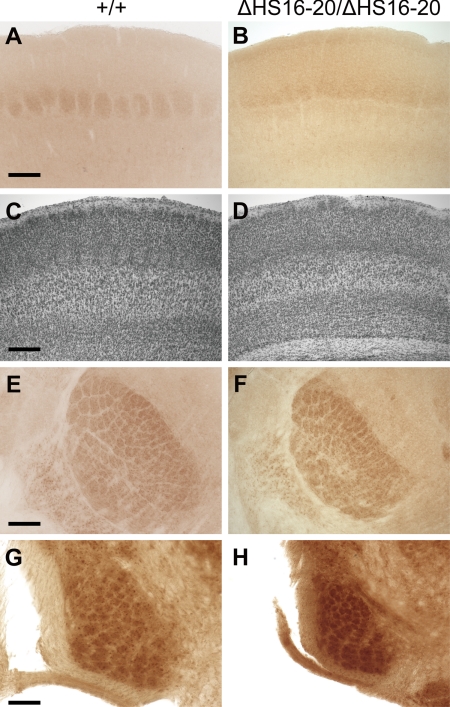
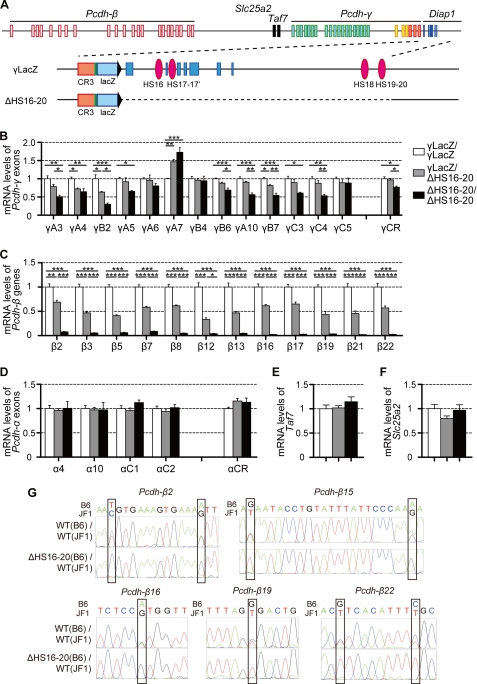
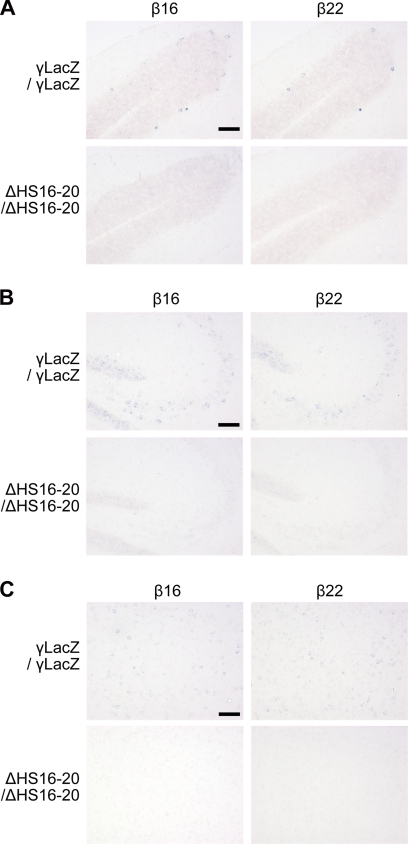
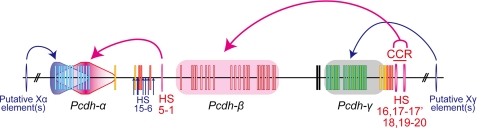
The clustered protocadherins (Pcdhs), Pcdh-α, -β, and -γ, are transmembrane proteins constituting a subgroup of the cadherin superfamily. Each Pcdh cluster is arranged in tandem on the same chromosome. Each of the three Pcdh clusters shows stochastic and combinatorial expression in individual neurons, thus generating a hugely diverse set of possible cell surface molecules. Therefore, the clustered Pcdhs are candidates for determining neuronal molecular diversity. Here, we showed that the targeted deletion of DNase I hypersensitive (HS) site HS5-1, previously identified as a Pcdh-α regulatory element in vitro, affects especially the expression of specific Pcdh-α isoforms in vivo. We also identified a Pcdh-β cluster control region (CCR) containing six HS sites (HS16, 17, 17', 18, 19, and 20) downstream of the Pcdh-γ cluster. This CCR comprehensively activates the expression of the Pcdh-β gene cluster in cis, and its deletion dramatically decreases their expression levels. Deleting the CCR nonuniformly down-regulates some Pcdh-γ isoforms and does not affect Pcdh-α expression. Thus, the CCR effect extends beyond the 320-kb region containing the Pcdh-γ cluster to activate the upstream Pcdh-β genes. Thus, we concluded that the CCR is a highly specific regulatory unit for Pcdh-β expression on the clustered Pcdh genomic locus. These findings suggest that each Pcdh cluster is controlled by distinct regulatory elements that activate their expression and that the stochastic gene regulation of the clustered Pcdhs is controlled by the complex chromatin architecture of the clustered Pcdh locus.


Figures

FIGURE 1.
FIGURE 1.
Strong effect of HS5-1 on the expression of Pcdh-α10–12 isoforms. A, schematic diagram of the clustered Pcdh family. The Pcdh-α gene contains 14 variable region (Vα) exons and three constant region (Cα) exons. The Pcdh-β cluster encodes 22 single-exon genes. The Pcdh-γ gene contains 22 variable region (Vγ) exons and three constant region (Cγ) exons. The adjacent, thick black bars upstream of the Pcdh-γ gene represent the Slc25a2 (left) and Taf7 (right) genes, which are not cadherin genes. The red oval indicates the position of HS5-1. B–D, imRNA levels of the Pcdh-α (B), Pcdh-β (C), and Pcdh-γ (D) genes measured in the whole brain at P21 by qPCR (n = 4). The y axis represents the mRNA level relative to WT. The deletion size of HS5-1 is 3276 bp. The HS5-1 deletion dramatically decreased the Pcdh-α10–12 expression. The Pcdh-α3–9 expression was significantly decreased according to the distance from HS5-1. The expression of the proximal Pcdh-β genes significantly increased depending on the distance from HS5-1. Results are the mean ± S.E. (error bars). *, p < 0.05; **, p < 0.01; ***, p < 0.001.
FIGURE 2.
FIGURE 2.
Identification of highly conserved regions in the Pcdh-γ locus. Sequence comparison of the Pcdh-β and Pcdh-γ genes among three species: mouse, human, and opossum. x-axis indicates the position of the genomic sequence from 5 kb upstream of the mouse Pcdh-β1 translation codon. The y axis indicates the percentage of similarity to the human (top alignment) and opossum (bottom alignment) sequence. Highly conserved regions are indicated by colored blocks. Constraints used were a 100-bp window length and 80% (Mouse/Human) or 70% (Mouse/Opossum) conservation level. Exonic regions are marked in dark blue and intronic regions in pink. Nineteen conserved elements were found between bps 546,187 and 620,459 in the mouse genomic sequence (supplemental Tables S3 and S4).
FIGURE 3.
FIGURE 3.
Identification of novel HS sites by DNase I hypersensitivity assay. A, schematic diagram of the DNase I hypersensitivity assay of the Pcdh-γ gene. Upper part, the large colored boxes, Pcdh-γ or Diap1 exons. The small red boxes indicate the 19 identified highly conserved elements. Lower part, restriction fragments used in the DNase I hypersensitive assay (black lines) and the Southern probes (black boxes). The lowercase letters in parentheses under the restriction fragments correspond to Fig. 3, B and C. Ba, BamHI; X, XbaI; N, NheI; S; SacI; A, ApaI; H, HindIII; Bg, BglI; K, KpnI. B, DNase I hypersensitivity assay. Nuclei were prepared from C1300 cells and treated with DNase I. The purified DNA was analyzed by Southern blotting. Black triangles indicate increasing concentrations of DNase I. The approximate size of each fragment (kb) and the position of each HS site are indicated. Asterisks indicate nonspecific signals. C, DNase I hypersensitivity assay in M3 cells. D, schematic showing the locations of the six identified HS sites. Red arrows indicate the position of each HS site.
FIGURE 4.
FIGURE 4.
The HS19–20 element has enhancer activity in vitro and in vivo. A, the identified HS sites were introduced into luciferase vectors containing a Pcdh-γA6 or -γB1 promoter, which were then transiently transfected into C1300 or M3 cells. The HS19–20 element had enhancer activity in both cell lines. The HS16 element had enhancer activity in only the M3 cells. Results are the mean ± S.D. (error bars). B, schematic represents the construct used for the HS19–20 enhancer assay. X-gal was used to stain the sagittal section of an E14.5 embryo harboring the HS19–20 transgene. Enhancer activity was detected in the central nervous system. Scale bar, 1 mm.
FIGURE 5.
FIGURE 5.
Disruption of the cortical barrel fields in ΔHS16–20 homozygous mice. A and B, cortical sections in control and HS16–20-deleted (ΔHS16–20/ΔHS16–20) mice were stained with cytochrome oxidase to visualize the barrel fields. Coronal sections revealed that the organization of barrels in the HS16–20-deleted brains was completely disrupted. C and D, Nissl staining of cortical sections showed defective organization in the HS16–20-deleted brains. E–H, coronal sections were cut through the thalamus (E and F) and brainstem (G and H), and stained with cytochrome oxidase. The barreloid and barrellette organization was similar in each genotype. Scale bars, 200 μm (A–F); 400 μm (G and H).
FIGURE 6.
FIGURE 6.
Deletion of HS16–20 dramatically decreases expression of the Pcdh-β genes. A, schematic representation of the wild-type allele and two strains of genetically manipulated mice. The HS16–20-deleted allele was generated by Cre-loxP–mediated trans-allelic recombination between the ΔHS19–20 and γLacZ alleles. Filled triangles show loxP sites. Red ovals indicate the position of each HS site. B–F, the mRNA levels of the Pcdh-γ (B), Pcdh-β (C), Pcdh-α (D), Taf7 (E), and Slc25a2 (F) genes were measured in the whole brain at E18.5 by qPCR (n = 4). The y axis represents the mRNA level relative to the γLacZ mice. The expression levels of the Pcdh-γ isoforms were significantly changed in the ΔHS16–20/ΔHS16–20 mice. The expression levels of the Pcdh-β genes were severely decreased in the ΔHS16–20/ΔHS16–20 mice. Results are the mean ± S.E. (error bars). *, p < 0.05; **, p < 0.01; ***, p < 0.001. G, sequence analysis of single-nucleotide polymorphisms between the B6 and JF1 strains. The Pcdh-β2, β15, β16, β19, and β22 cDNAs were obtained from mouse whole brain at E18.5 and sequenced. The +/ΔHS16–20 mice strongly expressed the JF1 allele, and the +/+ littermate mice expressed both alleles, indicating that the CCR containing HS16–20 is a cis-acting regulatory element.
FIGURE 7.
FIGURE 7.
The Pcdh-β gene transcripts are not detected in the ΔHS16–20-homozygous mice. In situ hybridization for Pcdh-β16 and Pcdh-β22 in γLacZ/γLacZ and ΔHS16–20/ΔHS16–20 mice at P21 is shown. In the ΔHS16–20/ΔHS16–20 mice, the scattered signals of these transcripts were not detected in the cerebellar Purkinje cells of the 6th cerebellar lobules (A), hippocampal CA3 region (B), or cerebral cortex (C). Scale bars, 100 μm.
FIGURE 8.
FIGURE 8.
Schematic diagram of the clustered protocadherin regulation by different regulatory elements. The CCR containing sites HS16–20 is located downstream of the Pcdh-γ cluster. The CCR had a strong effect on the expression of Pcdh-β genes, but only a partial effect on the Pcdh-γ cluster. The CCR did not affect the expression of the Pcdh-α gene cluster. To activate the expression of the Pcdh-γ gene cluster, other regulatory elements must exist, termed the Xγ element(s). HS5-1 strongly regulates the expression of the Pcdh-α10–12 isoforms. In addition, HS5-1 affects the expression of Pcdh-α3–12, depending on the distance. The 5′ end Pcdh-α isoforms require other regulatory elements in the 5′ region of Pcdh-α, termed the Xα element(s), which would have a relative effect for up-regulating the Pcdh-α isoforms.

Similar articles

Cited by

References

    1. Yagi T. (2008) Dev. Growth Differ 50, S131–140 - PubMed
    1. Zipursky S. L., Sanes J. R. (2010) Cell 143, 343–353 - PubMed
    1. Kohmura N., Senzaki K., Hamada S., Kai N., Yasuda R., Watanabe M., Ishii H., Yasuda M., Mishina M., Yagi T. (1998) Neuron 20, 1137–1151 - PubMed
    1. Wu Q., Maniatis T. (1999) Cell 97, 779–790 - PubMed
    1. Wu Q., Zhang T., Cheng J. F., Kim Y., Grimwood J., Schmutz J., Dickson M., Noonan J. P., Zhang M. Q., Myers R. M., Maniatis T. (2001) Genome Res. 11, 389–404 - PMC - PubMed

Publication types

LinkOut - more resources