. 2011 Aug;138(16):3519-31.
doi: 10.1242/dev.064006. Epub 2011 Jul 19.

Ascl1 expression defines a subpopulation of lineage-restricted progenitors in the mammalian retina

Affiliations

Ascl1 expression defines a subpopulation of lineage-restricted progenitors in the mammalian retina

Joseph A Brzezinski 4th et al. Development. 2011 Aug.

Abstract

The mechanisms of cell fate diversification in the retina are not fully understood. The seven principal cell types of the neural retina derive from a population of multipotent progenitors during development. These progenitors give rise to multiple cell types concurrently, suggesting that progenitors are a heterogeneous population. It is thought that differences in progenitor gene expression are responsible for differences in progenitor competence (i.e. potential) and, subsequently, fate diversification. To elucidate further the mechanisms of fate diversification, we assayed the expression of three transcription factors made by retinal progenitors: Ascl1 (Mash1), Ngn2 (Neurog2) and Olig2. We observed that progenitors were heterogeneous, expressing every possible combination of these transcription factors. To determine whether this progenitor heterogeneity correlated with different cell fate outcomes, we conducted Ascl1- and Ngn2-inducible expression fate mapping using the CreER™/LoxP system. We found that these two factors gave rise to markedly different distributions of cells. The Ngn2 lineage comprised all cell types, but retinal ganglion cells (RGCs) were exceedingly rare in the Ascl1 lineage. We next determined whether Ascl1 prevented RGC development. Ascl1-null mice had normal numbers of RGCs and, interestingly, we observed that a subset of Ascl1+ cells could give rise to cells expressing Math5 (Atoh7), a transcription factor required for RGC competence. Our results link progenitor heterogeneity to different fate outcomes. We show that Ascl1 expression defines a competence-restricted progenitor lineage in the retina, providing a new mechanism to explain fate diversification.


Figures

Fig. 1.
Fig. 1.
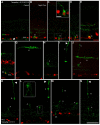
Retinal progenitor transcription factor expression heterogeneity. (A,B) E12.5 (A) and E13.5 (B) Ascl1GFP/+ mouse retinas stained for Ascl1-GFP (nuclear; green) and Ngn2 (red). Ascl1-GFP expression starts centrally and spreads towards the periphery with age (leading edge marked with arrowheads). (C-E) E14.5 retinas stained for Sox2 (red) and Ascl1-GFP (green). A small number of Ascl1– GFP+ cells do not express Sox2 (arrowhead; enlarged in inset). (F-L) Ascl1-GFP (green), Olig2 (gray) and Ngn2 (red) staining of the E14.5 retina. Cells that express Ascl1-GFP only; Olig2 only; Ngn2 only; Ascl1-GFP and Olig2; Ascl1-GFP and Ngn2; Olig2 and Ngn2; and all three transcription factors (arrows; enlarged in inset) are observed. (M) Ascl1-GFP, Olig2 and Ngn2 expression in E14.5 Ascl1GFP/GFP-null retinas is similar to control (L). A co-expressing cell is enlarged in inset. GCL, ganglion cell layer; L, lens; O, optic nerve head. Scale bars: 100 μm for A,B; 50 μm for C-M; 10 μm for higher magnification insets.
Fig. 2.
Fig. 2.
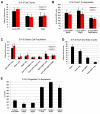
Transcription factor expression in E14.5 Ascl1GFP/+ heterozygous and null mouse retinas. (A) Plot showing the number of cells that express Ascl1-GFP, Ngn2 and Olig2 at E14.5. The number of cells that express each factor is similar in Ascl1 mutants (red) and heterozygotes (black). (B) Plot showing the percent of Ascl1-GFP+ cells that co-express Ngn2, Olig2 or both. Ascl1 mutants (red) have fewer Ascl1-GFP+ cells that make Olig2 than controls (black) (unpaired t-test, *P≤0.05). (C) Plot showing the number of cells that express each of seven combinations of transcription factors. Ascl1GFP/GFP-null mice have a similar distribution of cells. (D) Plot of Sox2+ and Ascl1-GFP+ cell numbers at E14.5. (E) Plot showing the percentage of progenitors that co-express Sox2 or Sox9. Error bars for all panels represent ±s.d.
Fig. 3.
Fig. 3.
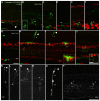
The E12.5/E13.5 Ascl1 lineage. Tamoxifen was administered at E12.5 and E13.5 and mice were examined as adults. (A) A control animal lacking the Ascl1-Cre (Ascl1+/+) transgene. There is a fibrous GFP antibody-specific background in the ganglion cell layer (GCL; arrow) and inner plexiform layer. (IPL). (B-P) Examples of Ascl1CreERT2/+ lineage-traced cells (isolated or in clumps) (green or gray) with cell-type specific labeling in A-J (red). (B-J) Displaced amacrines (dA), inner nuclear layer (INL) amacrines (A), rods (R) and horizontal cells (H) are seen. (K-P) Examples of cones (C), rods, bipolar cells (B), amacrine cells and Müller glia (M) seen in the Ascl1 lineage. (B-G) Cells in the GCL are labeled by pan-Brn3 (Brn3*), Brn3a/b, Neurofilament-M (NFM) or with retrograde uptake of biotinylated dextran to label retinal ganglion cells (RGCs), and with AP2α to label displaced amacrines (all in red). Nearly all GCL cells are label-negative displaced amacrine cells. (H-J) Horizontal and amacrine cells are co-labeled with calbindin (red) or Pax6 (red). Arrowheads denote outer segments of photoreceptors. Scale bars: 50 μm for A-C,H-P; 25 μm for D-G; 10 μm for insets.
Fig. 4.
Fig. 4.
The E17.5 Ascl1 lineage. Tamoxifen was given at E17.5 and mice were examined as adults. (A) A control animal lacking Ascl1-Cre (Ascl1+/+) has only background GFP staining (gray, arrow). (B-L) Examples of Ascl1CreERT2/+ lineage-traced cells (gray). Shown are examples of rods (R), amacrines (A), bipolars (B), cones (C) and Müller glia (M). Arrowheads denote photoreceptor outer segments. Scale bars: 50 μm for A-L: 10 μm for insets.
Fig. 5.
Fig. 5.
Loss of Ascl1 does not affect retinal ganglion cell (RGC) numbers. (A-H) E13.5 Ascl1GFP/+::Math5Cre/+ transheterozygous mice stained for Ascl1-GFP (green), Math5-Cre (gray) and pan-Brn3 (red). (A-D) The central retinas of E13.5 animals have many cells that co-express Math5-Cre and Brn3. Numerous Ascl1-GFP+ cells co-express Math5-Cre (arrows), but none co-expresses Ascl1-GFP and Brn3. (E-H) E13.5 peripheral retina showing the leading edge of Math5-Cre (white arrowhead), Brn3 (red arrowhead) and Ascl1-GFP (green arrowhead) expression. Only one cell made Ascl1-GFP, Math5-Cre and Brn3 (arrows). (I-L) Pan-Brn3 stains of E14.5 (I,J) and E18.5 (K,L) Ascl1GFP/+ heterozygous (I,K) and null (J,L) retinas. C, central; GCL, ganglion cell layer; P, peripheral. Scale bars: 50 μm for A-L; 10 μm for insets. (M) Plot of Ascl1-GFP, Math5-Cre and Brn3 cell counts at E13.5 (black) and E18.5 (red). (N) Plot of overlap between Ascl1-GFP and Math5-Cre at E13.5 (black) and E18.5 (red). (O) Plot showing the number of Brn3+ RGCs at E14.5 and E18.5 for Ascl1GFP/+ heterozygotes (black) and null (red) retinas. Error bars represent ±s.d. for all panels.
Fig. 6.
Fig. 6.
Ngn2 lineage traces. Tamoxifen was given at E12.5 and E13.5 or at E17.5 and mice were examined as adults. (A-J) E12.5/E13.5 Ngn2CreERTM/+ lineage traces (green) co-stained with pan-Brn3 (Brn3*), Brn3a/b, or by retrograde uptake of biotinylated dextran to mark retinal ganglion cells (RGCs; red). (A) Control mice lacking Ngn2-Cre (Ngn2+/+) have only fibrous GFP background (arrow). (B-J) Ngn2 lineage-traced RGCs (G), horizontals (H), cones (C) and amacrines (A) are shown. (F) Displaced amacrines (dA) are marked with AP2α staining (red) in the ganglion cell layer (GCL). (K-N) E17.5 Ngn2 lineage trace showing rods (R), amacrines (A), displaced amacrines (dA) and cones (C). Arrowheads mark photoreceptor outer segments. Scale bars: 50 μm for AN; 10 μm for insets.
Fig. 7.
Fig. 7.
Fate distribution and clump sizes in the Ascl1 and Ngn2 lineages. (A) Plot of the fate distributions of E12.5/E13.5 Ascl1 (black) and Ngn2 (red) lineages. The Ascl1 lineage and Ngn2 lineages have significantly different distributions (χ2, P<0.001); the Ascl1 lineage nearly lacks retinal ganglion cells (RGCs) and contains more late-born cell fates. (B) Distribution of E17.5 Ascl1 (black) and Ngn2 (red) lineages. Compared with the Ngn2 lineage, the Ascl1 lineage has more late-born cell types (χ2, P<0.001). G, RGC; H, horizontal; C, cone; dA, displaced amacrine; A, amacrine; R, rod; B, bipolar; M, Müller glia. Error bars represent ±s.e.m. (C,D) Histogram showing clump size frequencies in the E12.5/E13.5 (C) and E17.5 (D) Ascl1 (black) and Ngn2 (red) lineages. The maximum clump size is 15 cells for the Ascl1 lineage and nine cells for the Ngn2 lineage at E12.5/13.5 (12 and seven cells, respectively, at E17.5). (E) Plot showing the average size of clumps in the Ascl1 and Ngn2 lineages. Ascl1 clumps are twice as large as Ngn2 clumps (Mann-Whitney test, **P<0.001). Error bars represent ±s.d.
Fig. 8.
Fig. 8.
Model based on lineage and expression data described in this report. Progenitors (Pr, Sox2+) that express neither Ascl1 nor Ngn2 have the potential to generate large clones (>16 cells) and adopt all cell fates. Ascl1+ progenitors (green) undergo fewer cell divisions (<16 cells) and generate all cell fates except retinal ganglion cells (RGCs), thus defining a competence-restricted lineage. Ngn2+ progenitors (red) can adopt RGC and all other cell fates, but appear to be in their last cell division. Many, or perhaps all, Ascl1+ progenitors in their last cell cycle co-express Ngn2 (yellow) and subsequently adopt non-RGC fates.

References

    1. Akagi T., Inoue T., Miyoshi G., Bessho Y., Takahashi M., Lee J. E., Guillemot F., Kageyama R. (2004). Requirement of multiple bHLH genes for retinal neuronal subtype specification. J. Biol. Chem. 279, 28492-28498 - PubMed
    1. Alvarez-Rodriguez R., Pons S. (2009). Expression of the proneural gene encoding Mash1 suppresses MYCN mitotic activity. J. Cell Sci. 122, 595-599 - PubMed
    1. Anchan R. M., Reh T. A., Angello J., Balliet A., Walker M. (1991). EGF and TGF-alpha stimulate retinal neuroepithelial cell proliferation in vitro. Neuron 6, 923-936 - PubMed
    1. Badea T. C., Nathans J. (2011). Morphologies of mouse retinal ganglion cells expressing transcription factors Brn3a, Brn3b, and Brn3c: analysis of wild type and mutant cells using genetically-directed sparse labeling. Vision Res. 51, 269-279 - PMC - PubMed
    1. Bassett E. A., Pontoriero G. F., Feng W., Marquardt T., Fini M. E., Williams T., West-Mays J. A. (2007). Conditional deletion of activating protein 2alpha (AP-2alpha) in the developing retina demonstrates non-cell-autonomous roles for AP-2alpha in optic cup development. Mol. Cell. Biol. 27, 7497-7510 - PMC - PubMed

Publication types

MeSH terms

Substances