

Quantification of mRNA and protein and integration with protein turnover in a bacterium
- PMID: 21772259
- PMCID: PMC3159969
- DOI: 10.1038/msb.2011.38
Quantification of mRNA and protein and integration with protein turnover in a bacterium
Abstract
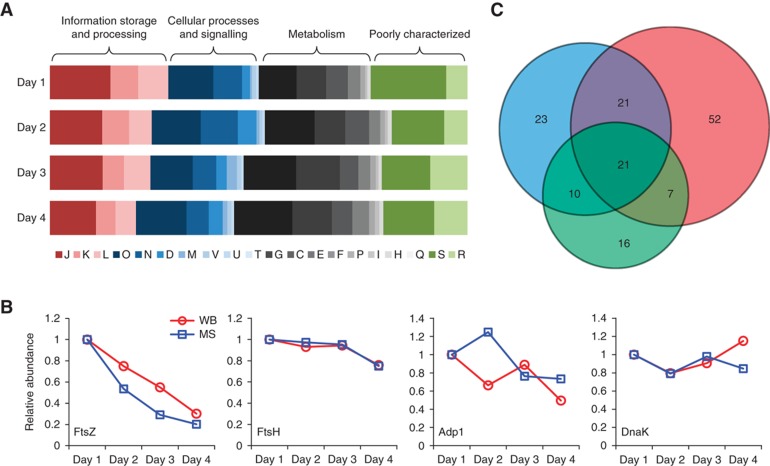
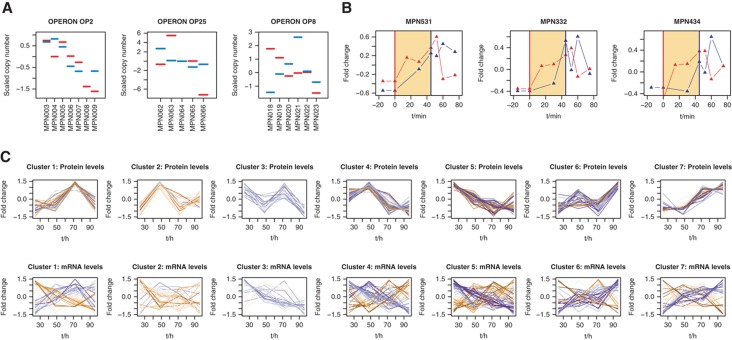
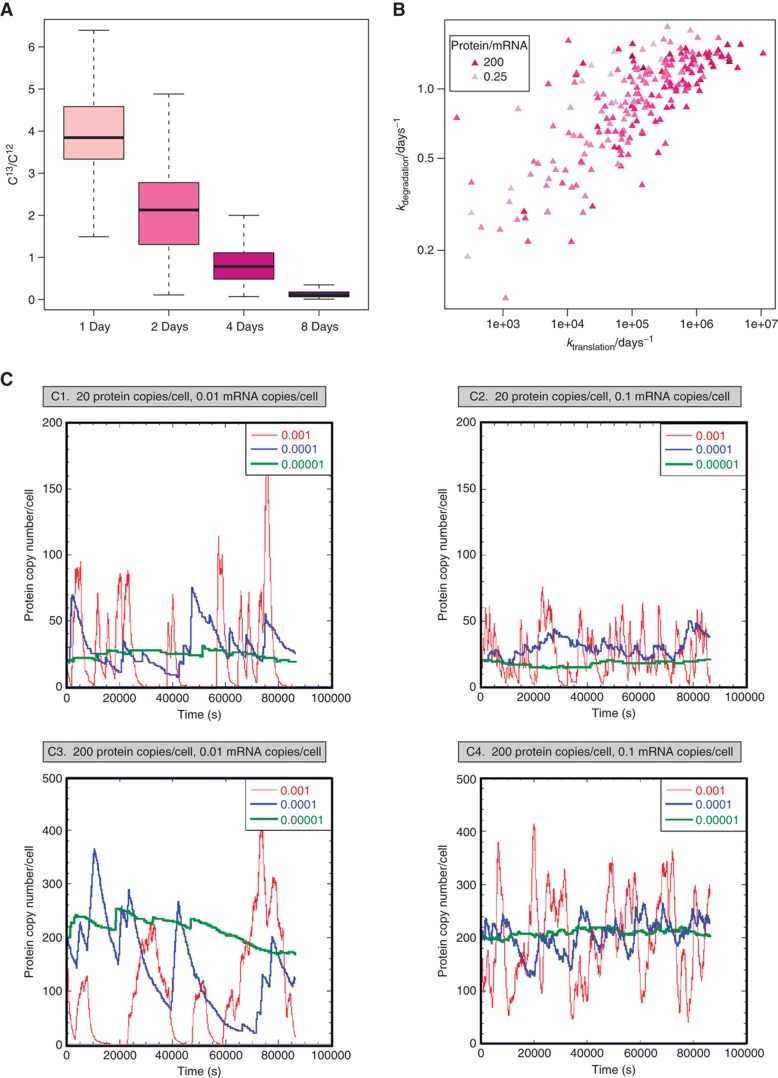
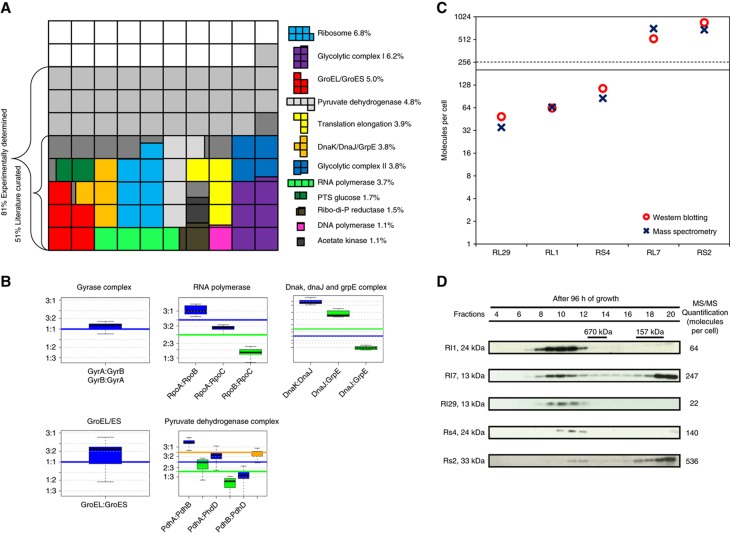
Biological function and cellular responses to environmental perturbations are regulated by a complex interplay of DNA, RNA, proteins and metabolites inside cells. To understand these central processes in living systems at the molecular level, we integrated experimentally determined abundance data for mRNA, proteins, as well as individual protein half-lives from the genome-reduced bacterium Mycoplasma pneumoniae. We provide a fine-grained, quantitative analysis of basic intracellular processes under various external conditions. Proteome composition changes in response to cellular perturbations reveal specific stress response strategies. The regulation of gene expression is largely decoupled from protein dynamics and translation efficiency has a higher regulatory impact on protein abundance than protein turnover. Stochastic simulations using in vivo data show how low translation efficiency and long protein half-lives effectively reduce biological noise in gene expression. Protein abundances are regulated in functional units, such as complexes or pathways, and reflect cellular lifestyles. Our study provides a detailed integrative analysis of average cellular protein abundances and the dynamic interplay of mRNA and proteins, the central biomolecules of a cell.
Conflict of interest statement
The authors declare that they have no conflict of interest.
Figures
Similar articles
-
Integration of multi-omics data of a genome-reduced bacterium: Prevalence of post-transcriptional regulation and its correlation with protein abundances.Nucleic Acids Res. 2016 Feb 18;44(3):1192-202. doi: 10.1093/nar/gkw004. Epub 2016 Jan 14. Nucleic Acids Res. 2016. PMID: 26773059 Free PMC article.
-
The proteome of Mycoplasma pneumoniae, a supposedly "simple" cell.Proteomics. 2011 Sep;11(18):3614-32. doi: 10.1002/pmic.201100076. Epub 2011 Aug 9. Proteomics. 2011. PMID: 21751371 Review.
-
Systems biology. Excavating the functional landscape of bacterial cells.Science. 2009 Nov 27;326(5957):1200-1. doi: 10.1126/science.1183757. Science. 2009. PMID: 19965458 No abstract available.
-
Proteome organization in a genome-reduced bacterium.Science. 2009 Nov 27;326(5957):1235-40. doi: 10.1126/science.1176343. Science. 2009. PMID: 19965468
-
Examination of post-transcriptional regulations in prokaryotes by integrative biology.C R Biol. 2009 Nov;332(11):958-73. doi: 10.1016/j.crvi.2009.09.005. Epub 2009 Oct 14. C R Biol. 2009. PMID: 19909919 Review.
Cited by
-
Stress levels over time in the introduced ascidian Styela plicata: the effects of temperature and salinity variations on hsp70 gene expression.Cell Stress Chaperones. 2012 Jul;17(4):435-44. doi: 10.1007/s12192-012-0321-y. Epub 2012 Jan 17. Cell Stress Chaperones. 2012. PMID: 22249790 Free PMC article.
-
Investment in rapid growth shapes the evolutionary rates of essential proteins.Proc Natl Acad Sci U S A. 2011 Dec 13;108(50):20030-5. doi: 10.1073/pnas.1110972108. Epub 2011 Nov 30. Proc Natl Acad Sci U S A. 2011. PMID: 22135464 Free PMC article.
-
Light-inducible protein degradation in E. coli with the LOVdeg tag.Elife. 2024 Jan 25;12:RP87303. doi: 10.7554/eLife.87303. Elife. 2024. PMID: 38270583 Free PMC article.
-
A genetic toolkit and gene switches to limit Mycoplasma growth for biosafety applications.Nat Commun. 2022 Apr 7;13(1):1910. doi: 10.1038/s41467-022-29574-0. Nat Commun. 2022. PMID: 35393441 Free PMC article.
-
Cellular and Molecular Changes in Hippocampal Glutamate Signaling and Alterations in Learning, Attention, and Impulsivity Following Prenatal Nicotine Exposure.Mol Neurobiol. 2020 Apr;57(4):2002-2020. doi: 10.1007/s12035-019-01854-9. Epub 2020 Jan 8. Mol Neurobiol. 2020. PMID: 31916029
References
-
- Ander M, Beltrao P, Di Ventura B, Ferkinghoff-Borg J, Foglierini M, Kaplan A, Lemerle C, Tomás-Oliveira I, Serrano L (2004) SmartCell, a framework to simulate cellular processes that combines stochastic approximation with diffusion and localisation: analysis of simple networks. Syst Biol 1: 129–138 - PubMed
-
- Arnold RJ, Reilly JP (1999) Observation of Escherichia coli ribosomal proteins and their posttranslational modifications by mass spectrometry. Anal Biochem 269: 105–112 - PubMed
-
- Beynon RJ, Pratt JM (2005) Metabolic labeling of proteins for proteomics. Mol Cell Proteomics 4: 857–872 - PubMed
Publication types
MeSH terms
Substances
Grants and funding
LinkOut - more resources
Full Text Sources
Other Literature Sources
