. 2011 Jul 4:4:8.
doi: 10.3389/fnmol.2011.00008. eCollection 2011.

A Molecular Toolbox for Rapid Generation of Viral Vectors to Up- or Down-Regulate Neuronal Gene Expression in vivo

Affiliations

A Molecular Toolbox for Rapid Generation of Viral Vectors to Up- or Down-Regulate Neuronal Gene Expression in vivo

Melanie D White et al. Front Mol Neurosci. .

Abstract

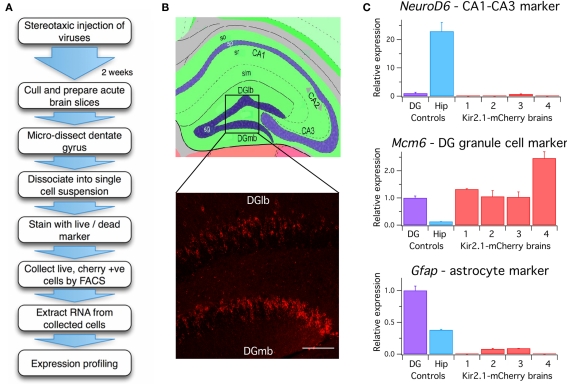
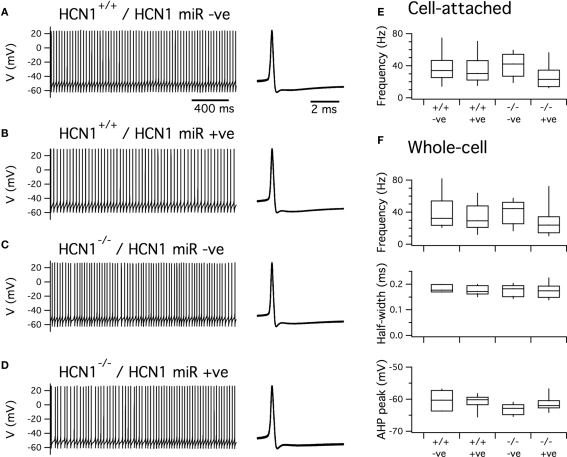
We introduce a molecular toolbox for manipulation of neuronal gene expression in vivo. The toolbox includes promoters, ion channels, optogenetic tools, fluorescent proteins, and intronic artificial microRNAs. The components are easily assembled into adeno-associated virus (AAV) or lentivirus vectors using recombination cloning. We demonstrate assembly of toolbox components into lentivirus and AAV vectors and use these vectors for in vivo expression of inwardly rectifying potassium channels (Kir2.1, Kir3.1, and Kir3.2) and an artificial microRNA targeted against the ion channel HCN1 (HCN1 miRNA). We show that AAV assembled to express HCN1 miRNA produces efficacious and specific in vivo knockdown of HCN1 channels. Comparison of in vivo viral transduction using HCN1 miRNA with mice containing a germ line deletion of HCN1 reveals similar physiological phenotypes in cerebellar Purkinje cells. The easy assembly and re-usability of the toolbox components, together with the ability to up- or down-regulate neuronal gene expression in vivo, may be useful for applications in many areas of neuroscience.

Keywords: AAV; RNAi; cerebellum; hippocampus; intronic miRNA; ion channel; lentivirus; virus.


Figures

Figure 1
Figure 1
Schematic illustrating modular cloning system. (A) Schematic illustrating recombination of entry vectors carrying cassettes flanked by att sites with a viral destination vector. In a single reaction recombination between matching att sites inserts the cassettes into the vector in the correct order, generating a viral expression construct. (B) Components of the molecular toolbox flanked with att sites ready for recombination. For simplicity, only the att-flanked regions of the entry vectors are illustrated in (B,C). (C) Examples of recombination reactions to generate the lentiviral expression construct plenti-CAMKII(0.4)-Kir2.1-mCherry and the AAV expression construct pAAV-ESYN-HCN1miR-EGFP.
Figure 2
Figure 2
Lentiviral expression of transgenes in hippocampal neurons. Examples of gene expression from lentiviruses injected into the hippocampus. (A) Expression of EYFP or Kir-reporter fusion proteins in CA1 pyramidal neurons of the hippocampus driven by the CAMKIIα short promoter. (B) Expression of EYFP in dentate gyrus granule cells driven by the Netrin G1 promoter. (C) EGFP expression in dentate gyrus granule cells driven by the ESYN promoter. Reporter protein expression is bright enough to enable imaging of dendritic spines (upper and lower right panels). Higher magnification spine images (lower right panel) correspond to different depths from a Z-stack of the region indicated by the white box (upper right panel). Scale bars = 100 μm for all images except the spine image, where the scale bar = 5 μm.
Figure 3
Figure 3
Analysis of mRNA expression from dentate gyrus granule cells transduced in vivo. (A) Flow diagram of procedure for ex vivo isolation of virally transduced cells from the dentate gyrus. (B) Upper panel: Schematic of the hippocampus adapted from the Allen Mouse Brain Reference Atlas. Virus was injected into the dentate gyrus. Lower panel: Expression of Kir2.1-mCherry in granule cells (sg) of the dentate gyrus lateral blade (DGlb) and medial blade (DGmb). Scale bar = 100 μm. (C) RT-PCR quantification of gene expression in Kir2.1-mCherry positive cell populations isolated from four lentivirally injected brains compared to control cells dissociated from the entire hippocampus (Hip) or microdissected dentate gyrus (DG) of pooled uninjected brains (n = 3). All reactions were performed in triplicate and normalized to the housekeeping gene Hprt1. Gene expression levels in the Kir2.1-mCherry positive cells are expressed relative to control cells isolated from the dentate gyrus of uninjected brains. A one-way ANOVA revealed a significant difference in gene expression between the brain samples for Neurod6 [F(5,9) = 50.713, p = 3 × 10−6], Mcm6 [F(5,9) = 8.204, p = 0.0036], and Gfap [F(5,9) = 154.442, p = 5 × 10−9], post hoc analysis showed the dissected dentate gyrus and the mCherry positive cells populations isolated from Kir2.1-mCherry injected brains had significantly lower Neurod6 expression than the entire hippocampus (p < 0.05 for DG, p < 0.005 for Kir2.1-mCherry brains, unpaired Student’s t-test). Expression of the granule cell marker Mcm6 was significantly higher in the Kir2.1-mCherry positive samples than in the entire hippocampus (p < 0.05, unpaired Student’s t-test). Gfap expression was significantly higher in the dentate gyrus than the entire hippocampus (p < 0.05, unpaired Student’s t-test), but the Kir2.1-mCherry positive samples expressed significantly less than both the dentate gyrus and the entire hippocampus (p < 0.005, unpaired Student’s t-test). so, stratum oriens; sp, stratum pyramidale; sr, stratum radiatum; slm, stratum lacunosum-moleculare.
Figure 4
Figure 4
Knockdown of a target gene and high co-expression of reporter gene following expression of constructs containing intronic artificial miRNAs. (A) Schematic illustrating processing of an artificial intronic miRNA construct. DNA transcription produces a pri-mRNA with an intronic miRNA. Cellular splicing excises the miRNA component ready for downstream processing, leaving a stable mRNA with a 5′CAP and polyA tail for the expression of EGFP. (B) In vitro testing of an intronic miRNA construct targeting expression of HCN1. HEK293FT cells were transfected with plasmids expressing HCN1-mCherry (red) alone or as a cotransfection with a vector encoding a miRNA targeting either HCN1 (pSM155-HCN1miR) or luciferase (pSM155-LucmiR; green). Transfection with the HCN1 miRNA reduced expression of HCN1-mCherry whereas the luciferase miRNA did not. Scale bar = 50 μm.
Figure 5
Figure 5
Expression of miRNAs targeted against HCN1 abolishes hyperpolarization-activated currents recorded from cerebellar Purkinje cells. (A) Native fluorescence of EGFP from cerebellar Purkinje cells transduced with AAVs expressing miRNAs targeting either luciferase (Luc miRNA) or HCN1 (HCN1 miR). The higher magnification image (right panel) corresponds to an HCN1miR expressing cell indicated by the white box (middle panel). Scale bars = 100 μm in left and middle panels, 10 μm in right panel. (B) Membrane current responses (upper three panels) to hyperpolarizing voltage steps (lower panel) recorded from a Purkinje cell infected with AAV expressing Luc miR (top), HCN1 miR (upper middle) or uninfected (lower middle). (C) Mean Ih tail current amplitude plotted as a function of test potential for each group of Purkinje cells. Tail current amplitudes differed between groups at membrane potentials ≤ −65 mV (p < 0.05, ANOVA). There was no significant difference between tail currents from Luc miR infected and uninfected neurons at any test potential (p > 0.05, unpaired Student’s t-test), whereas tail currents from cells infected with HCN1 miR differed from the Luc miR group at potentials ≤ −75 mV and from the uninfected group at all test potentials (p < 0.05, unpaired Student’s t-test). (D) Activation time constant plotted as a function of test potential for Ih recorded from uninfected Purkinje cells and from Purkinje cells infected with Luc miR. The time constant did not differ significantly between uninfected and Luc miR infected Purkinje cells at any test potential (p > 0.05, unpaired Student’s t-test). Group sizes for voltage-clamp experiments were as follows: Luc miR (n = 6 cells, 3 mice); HCN1 miR (n = 6 cells, 3 mice); uninfected (n = 6 cells, 4 mice).
Figure 6
Figure 6
Expression of HCN1 miR does not affect spontaneous firing of cerebellar Purkinje cells. (A–D). Examples of spontaneous action potentials recorded from cerebellar Purkinje cells in brain slices obtained from control mice (A,B) or global HCN1 knockout mice (C,D). Purkinje cells were either positive for EGFP indicating expression of HCN1 miRNA (B,D) or were EGFP negative indicating they did not express HCN1 miRNA (A,C). (E) Frequency of spontaneous action potentials recorded from Purkinje cells in the cell-attached configuration. There was no significant effect of genotype (p = 0.59) or AAV infection (p = 0.14). (F) Frequency (upper panel), half-width (middle panel), and peak after-hyperpolarization (lower panel) for spontaneous action potentials recorded from Purkinje cells in the current-clamp configuration. There was no significant effect of AAV on any parameter (p > 0.14) and no significant effect of genotype on spike frequency or AHP duration. There was a significant effect of genotype on the AHP peak (p = 0.034). This effect is small and is inconsistent with previous comparisons suggesting it may simply reflect a chance outcome expected from repeated statistical testing. Statistical analysis uses ANOVA. Group sizes were as follows: HCN1+/+, HCN1 miR –ve (n = 7 cells, 3 mice); HCN1+/+, HCN1 miR+ve (n = 9 cells, 3 mice); HCN1+/+, HCN1 miR –ve (n = 9 cells, 3 mice); HCN1−/−, HCN1 miR+ve (n = 9 cells, 3 mice).
Figure 7
Figure 7
HCN1 miR expression and global deletion of HCN1 cause similar physiological phenotypes in cerebellar Purkinje cells. (A,B) Examples of responses of Purkinje cells from wild-type (A) and global HCN1 knockout mice (B) to series of current steps. Upper traces are recordings from uninfected Purkinje cells. Lower traces are recordings from Purkinje cells infected with AAV HCN1 miRNA EGFP. Graphs plot spike frequency and modal membrane potential as a function of the amplitude of the test current step. (C,D) Plot of the average across all neurons in each group of the spike frequency (C) and modal membrane potential (D) as a function of the amplitude of the test current step. There was no significant effect (p < 0.05) of genotype or AAV expression on the spike frequency at any amplitude of current step. In contrast, the amplitude of the membrane potential change depended on genotype and AAV expression (for −500 pA current steps, p = 0.0061 for genotype, p = 0.0044 for AAV infection, and p = 0.0050 for interaction between AAV infection and genotype). Numbers of neurons and mice are as in Figure 6.

References

    1. Abordo-Adesida E., Follenzi A., Barcia C., Sciascia S., Castro M. G., Naldini L., Lowenstein P. R. (2005). Stability of lentiviral vector-mediated transgene expression in the brain in the presence of systemic antivector immune responses. Hum. Gene Ther. 16, 741–75110.1089/hum.2005.16.741 - DOI - PMC - PubMed
    1. Atasoy D., Aponte Y., Su H. H., Sternson S. M. (2008). A FLEX switch targets Channelrhodopsin-2 to multiple cell types for imaging and long-range circuit mapping. J. Neurosci. 28, 7025–703010.1523/JNEUROSCI.2432-08.2008 - DOI - PMC - PubMed
    1. Baekelandt V., Eggermont K., Michiels M., Nuttin B., Debyser Z. (2003). Optimized lentiviral vector production and purification procedure prevents immune response after transduction of mouse brain. Gene Ther. 10, 1933–194010.1038/sj.gt.3302094 - DOI - PubMed
    1. Birmingham A., Anderson E. M., Reynolds A., Ilsley-Tyree D., Leake D., Fedorov Y., Baskerville S., Maksimova E., Robinson K., Karpilow J., Marshall W. S., Khvorova A. (2006). 3′ UTR seed matches, but not overall identity, are associated with RNAi off-targets. Nat. Methods 3, 199–20410.1038/nmeth0606-487a - DOI - PubMed
    1. Bridge A. J., Pebernard S., Ducraux A., Nicoulaz A. L., Iggo R. (2003). Induction of an interferon response by RNAi vectors in mammalian cells. Nat. Genet. 34, 263–26410.1038/ng1173 - DOI - PubMed