

Serum lipidomics profiling using LC-MS and high-energy collisional dissociation fragmentation: focus on triglyceride detection and characterization
- PMID: 21774539
- PMCID: PMC3165109
- DOI: 10.1021/ac201195d
Serum lipidomics profiling using LC-MS and high-energy collisional dissociation fragmentation: focus on triglyceride detection and characterization
Abstract
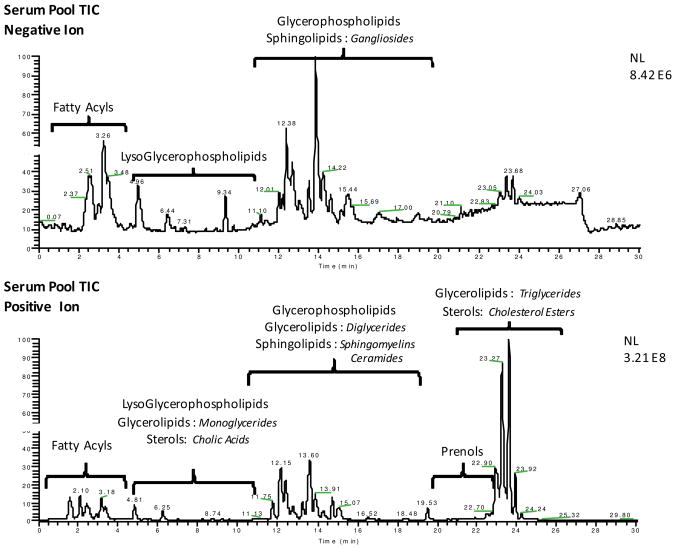
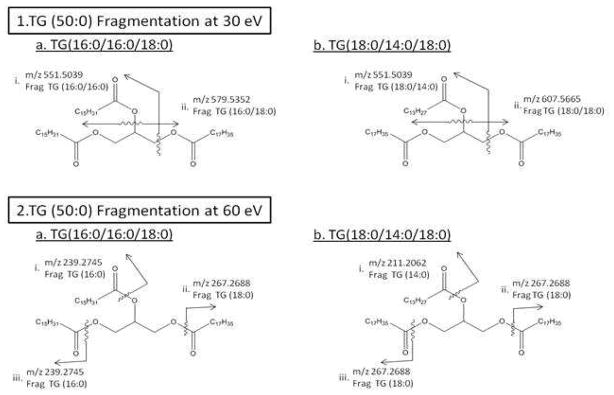
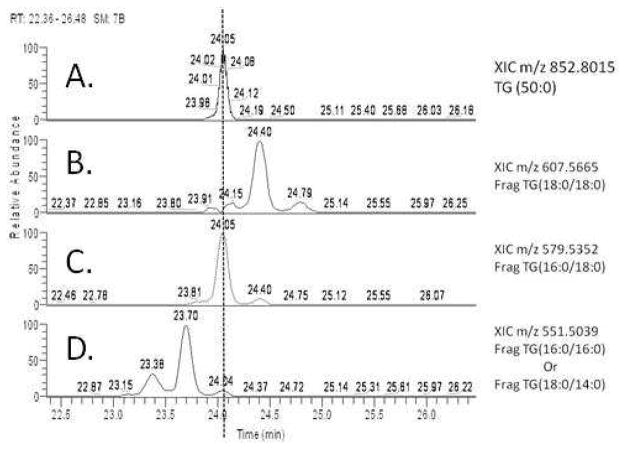
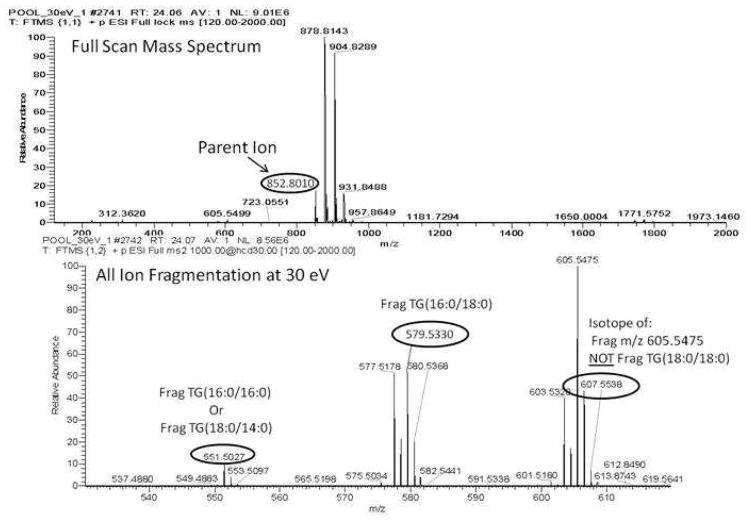
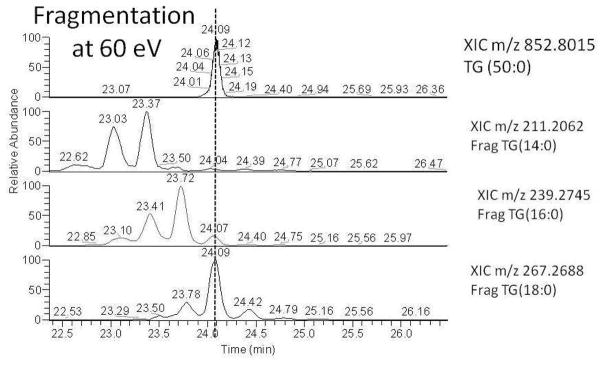
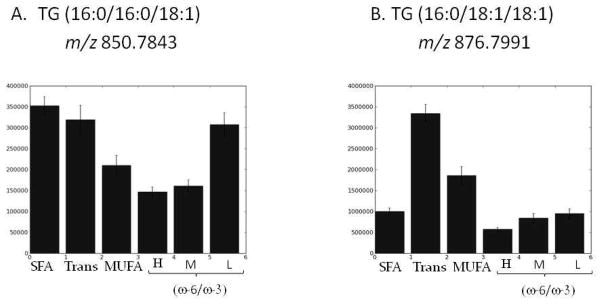
There is a growing need both clinically and experimentally to improve the characterization of blood lipids. A liquid chromatography-mass spectrometry (LC-MS) method, developed for the qualitative and semiquantitative detection of lipids in biological samples and previously validated in mitochondrial samples, was now evaluated for the profiling of serum lipids. Data were acquired using high-resolution, full scan MS and high-energy, collisional dissociation (HCD), all ion fragmentation. The method was designed for efficient separation and detection in both positive and negative ionization mode and evaluated using standards spanning seven lipid classes. Platform performance, related to the identification and characterization of serum triglycerides (TGs), was assessed using extracted ion chromatograms with mass tolerance windows of 5 ppm or less from full scan exact mass measurements determined using SIEVE nondifferential LC-MS analysis software. The platform showed retention time coefficients of variation (CV) of <0.3%, mass accuracy values of <2 ppm error, and peak area CV of <13%, with the majority of that error coming from sample preparation and extraction rather than the LC-MS analysis, and linearity was shown to be over 4 orders of magnitude (r(2) = 0.999) for the standard TG (15:0)(3) spiked into serum. Instrument mass accuracy and precision were critical to the identification of unknown TG species, in part because these parameters enabled us to reduce false positives. In addition to detection and relative quantitation of TGs in serum, TG structures were characterized through the use of alternating HCD scans at different energies to produce diagnostic fragmentations on all ions in the analysis. The lipidomics method was applied to serum samples from 192 rats maintained on diets differing in macronutrient composition. The analysis identified 86 TG species with 81 unique masses that varied over 3.5 orders of magnitude and showed diet-dependency, consistent with TGs linking diet and disease risk.
Figures
References
-
- Kotronen A, Velagapudi VR, Yetukuri L, Westerbacka J, Bergholm R, Ekroos K, Makkonen J, Taskinen MR, Oresic M, Yki-Jarvinen H. Diabetologia. 2009;52:684–690. - PubMed
-
- Quehenberger O, Armando AM, Brown AH, Milne SB, Myers DS, Merrill AH, Bandyopadhyay S, Jones KN, Kelly S, Shaner RL, Sullards CM, Wang E, Murphy RC, Barkley RM, Leiker TJ, Raetz CR, Guan Z, Laird GM, Six DA, Russell DW, McDonald JG, Subramaniam S, Fahy E, Dennis EA. J Lipid Res. 51:3299–3305. - PMC - PubMed
-
- Li M, Zhou Z, Nie H, Bai Y, Liu H. Anal Bioanal Chem. 2010 - PubMed
Publication types
MeSH terms
Substances
Grants and funding
LinkOut - more resources
Full Text Sources
Other Literature Sources
Miscellaneous
