. 2011;63(6):950-9.
doi: 10.1080/01635581.2011.590266. Epub 2011 Jul 20.

High dietary niacin may increase prostaglandin formation but does not increase tumor formation in ApcMin/+ mice

Affiliations

High dietary niacin may increase prostaglandin formation but does not increase tumor formation in ApcMin/+ mice

Alan M Kwong et al. Nutr Cancer. 2011.

Abstract

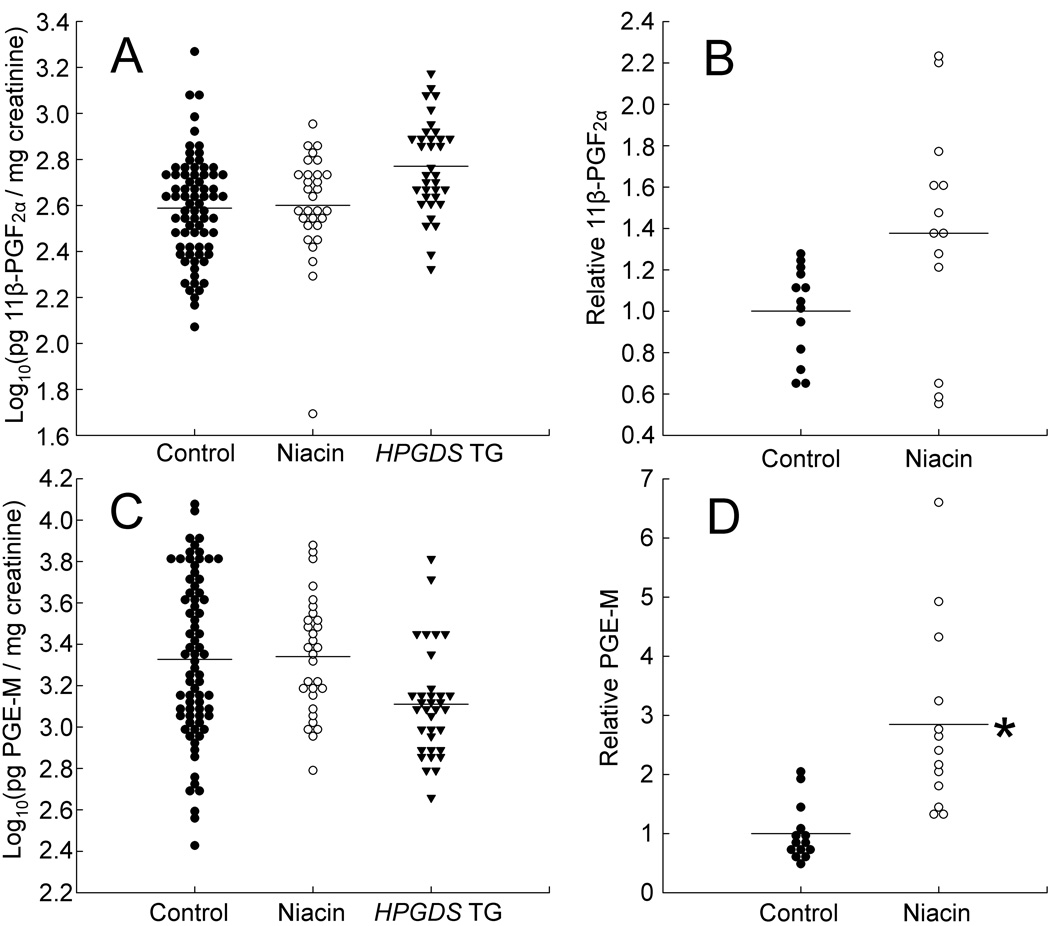
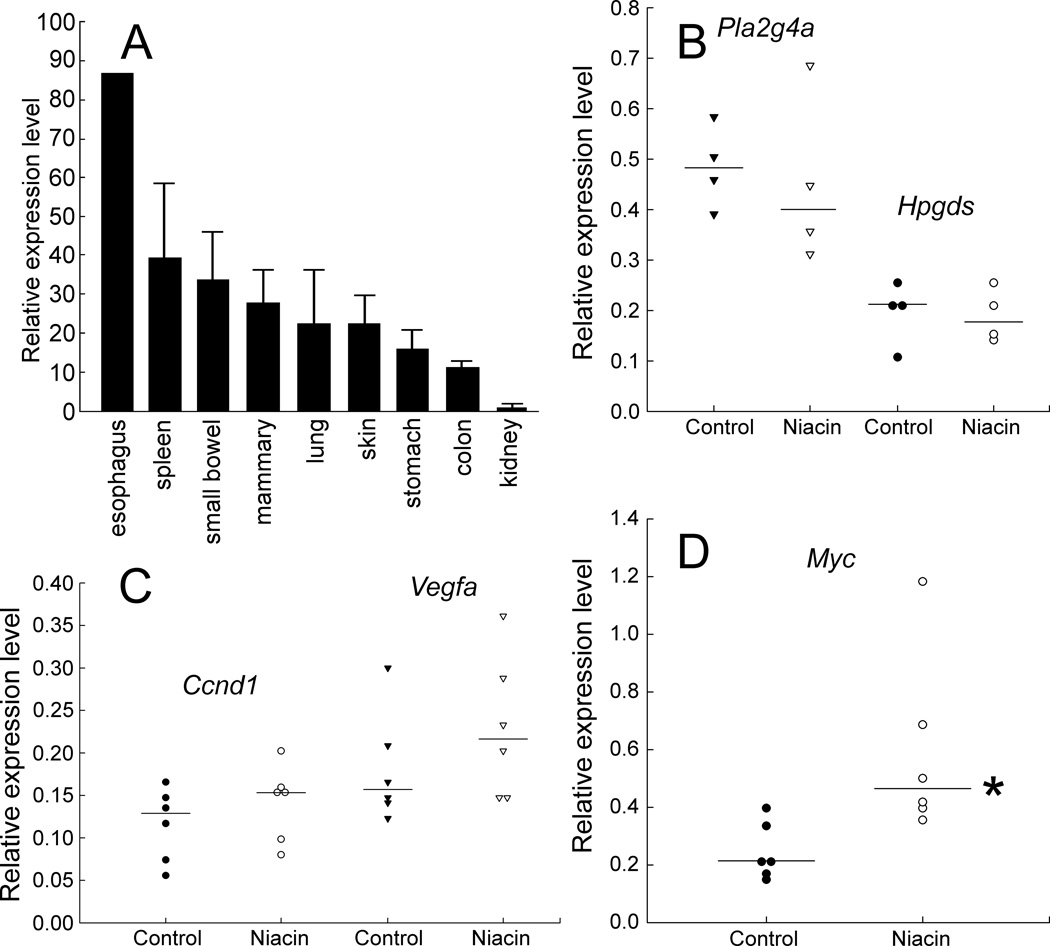
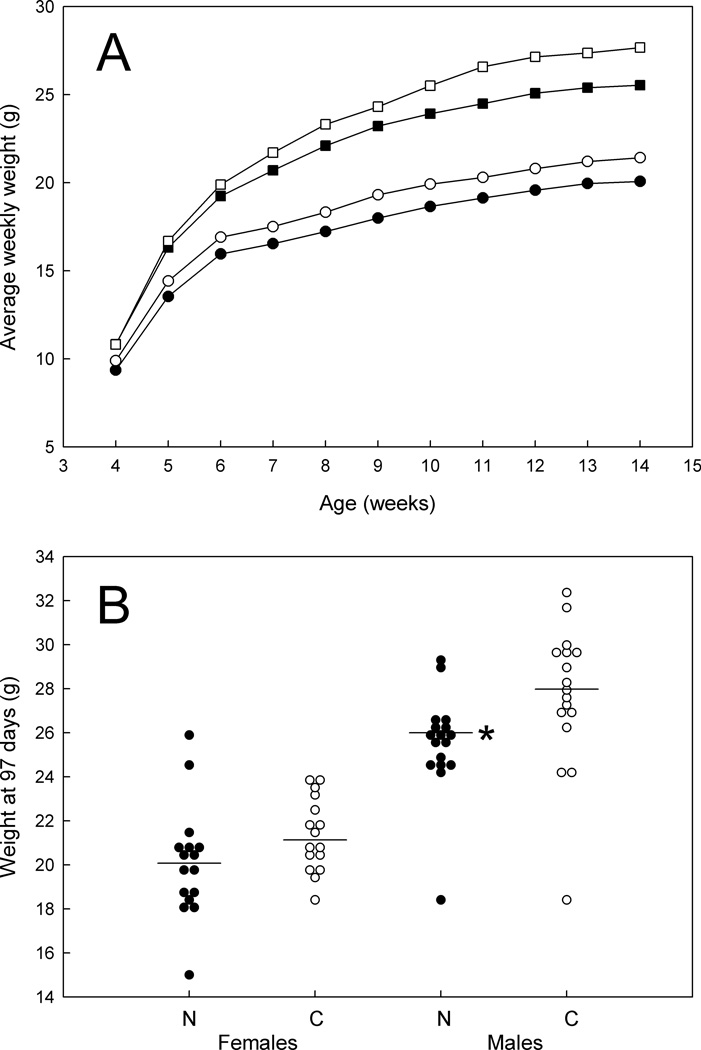
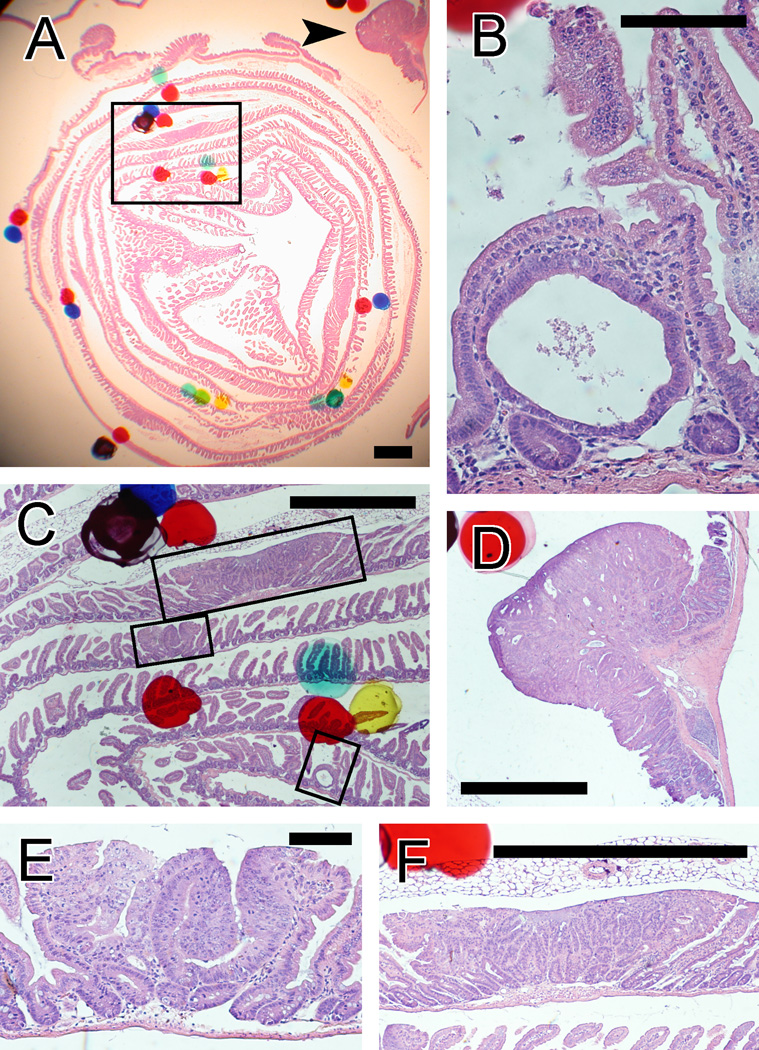
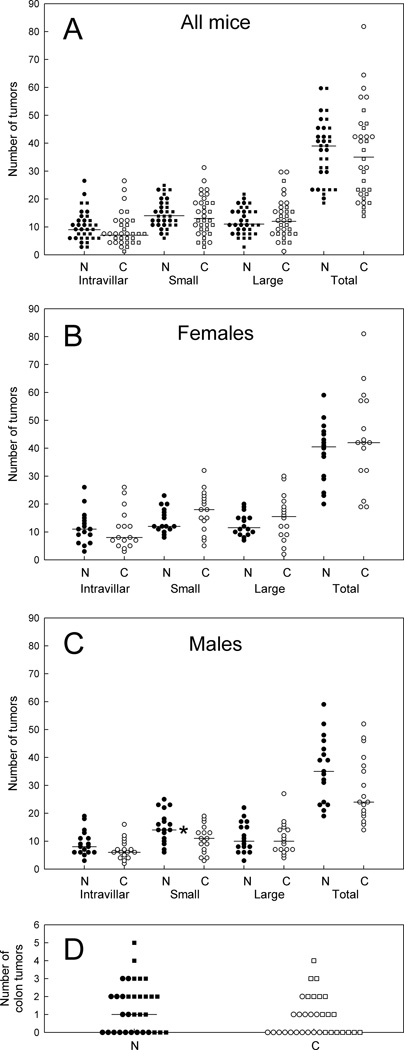
High doses of niacin (nicotinic acid) used to treat dyslipidemias cause flushing, due to high levels of prostaglandin D(2) (PGD(2)). GPR109A, a G-protein coupled receptor, triggers the flushing in the skin. In addition to boosting PGD(2), niacin binding to GPR109A activates the entire prostanoid cascade. We found that GPR109A occurs throughout the gastrointestinal tract. Mice that alternated between a 1% niacin diet and a control diet had higher urinary prostaglandin E(2) (PGE(2)) metabolite levels when on niacin (2.8-fold increase; 95% confidence interval, 1.8-3.9). PGE(2) promotes tumors in the intestines, whereas PGD(2) may have an opposite effect, on the basis of our report showing that transgenic hematopoietic prostaglandin D synthase suppresses intestinal adenomas in Apc(Min/+) mice. To determine if either tumor growth or tumor suppression prevails, we fed Apc(Min/+) mice a 1% niacin diet and assessed tumor development. A 1% niacin diet did not affect the number of tumors scored histologically in Apc(Min/+) mice at 14 wk (33 mice on niacin, 33 controls). Although niacin stimulates production of various prostaglandins, our results support an interpretation that very high intakes of niacin are safe in relation to intestinal tumors in this model.


Figures

FIG. 1
FIG. 1
Urinary excretion of 11β-PGF (a major PGD2 metabolite) and PGE-M (the major PGE2 metabolite). Numbers of urine specimens, numbers of mice, and results are summarized in Table 1. A: Urinary 11β-PGF in relation to 1% niacin and HPGDS transgenes. 11β-PGF levels (in pg per mg of creatinine) were transformed to logarithms (base 10). Estimated mean levels were 403, 385 (P = 0.94), and 633 (P = 0.19), for controls, mice on 1% niacin, and HPGDS transgenic mice, respectively. The graph includes data on mixed background mice (C57BL/6 × FVB/N) as well as C57BL/6 mice, but no ApcMin/+ mice. B: Relative urinary 11β-PGF excretion levels in 4 mice that alternated between the control diet and the 1% niacin diet. For each of these 4 mice, urine prostaglandins were measured on the control diet and on the 1% niacin diet. All prostaglandin levels for each mouse were divided by the mean value of the control measurements for that mouse. Data for all 4 mice were then pooled and analyzed. The mean increase in 11β-PGF excretion on the 1% niacin diet was 1.34-fold (P = 0.07). Numbers of urine specimens and of mice are shown in Table 1. C: Urinary PGE-M in relation to 1% niacin and HPGDS transgenes. PGE-M levels (in pg per mg of creatinine) were transformed to logarithms (base 10). Estimated mean levels were 1,995, 2,196 (P = 0.92), and 1,622 (P = 0.72), for controls, mice on 1% niacin, and HPGDS transgenic mice, respectively. The mice were the same as used for panel A, except there were a few missing data, due to inadequate amounts of urine for a few of the mice. D: Relative urinary PGE-M excretion levels in 4 mice that alternated between the control diet and the 1% niacin diet. Data were collected and analyzed as for panel B. The mean increase in PGE-M excretion on the 1% niacin diet was 2.85-fold (P = 0.02).
FIG. 2
FIG. 2
Expression of Gpr109a, selected prostaglandin biosynthetic enzymes, and growth factors in the experiment. A: Gpr109a mRNA in 9 tissues in wild-type, mixed background mice (C57BL/6 × FVB/N). All mice were on a diet with no supplemental niacin. Levels were expressed relative to mRNA levels for endogenous mouse glyceraldehyde-3-phosphate dehydrogenase (Gapdh). The Gpr109a level in the kidney was set to 1.0 (lowest value). Thick bars represent the average expression among 3 mice. Lines indicate standard deviations. mRNA levels for all tissues were measured in triplicate for each mouse. No standard deviation is shown for the esophagus, because tissue specimens from the 3 mice were combined (specimens were too small to assay individually). The esophagus had the highest Gpr109a expression among the tissues tested, followed by the spleen. Gpr109a expression levels were fairly comparable among the small intestine, mammary gland, lung, and skin. B: Cytosolic phospholipase A2 (Pla2g4a) and hematopoietic prostaglandin D synthase (Hpgds) expression in the colon. mRNA was measured in colon tissue of ApcMin/+ mice on a control diet or daily 1% niacin. Levels were expressed relative to mRNA levels for endogenous mouse Gapdh. The plotted points represent triplicate measurements in different mice. Horizontal bars indicate medians. Median values for control and niacin-fed mice (respectively) were: for Pla2g4a, 0.48 and 0.40 (P = 0.71); for Hpgds, 0.21 and 0.18 (P = 0.83). C and D: Ccnd1, Vegfa, and Myc oncogene expression. mRNA was measured in colon tissue of ApcMin/+ mice on a control diet or daily 1% niacin, as described for panel B above. Median values for control and niacin-fed mice (respectively) were: for Ccnd1, 0.13 and 0.15 (P = 0.30); for Vegfa, 0.16 and 0.22 (P = 0.30); for Myc, 0.21 and 0.46 (P = 0.005). * indicates P < 0.05.
FIG. 3
FIG. 3
Growth of ApcMin/+ mice on 1% niacin versus control diets. A: Combined average weights of the mice, by week. Open squares, males on the control diet. Filled squares, males on the 1% niacin diet. Open circles, females on the control diet. Filled circles, females on the 1% niacin diet. B: Weights at 97 days (14 weeks). N, mice on the 1% niacin diet. C, mice on the control diet. * indicates P < 0.05.
FIG. 4
FIG. 4
Examples of intestinal tumors in a Swiss roll section from an ApcMin/+ mouse, seen through a stereomicroscope (A) and at higher magnification (B–F). Hematoxylin and eosin staining. A: Tumors are visible with very low magnification (<40×), although screening of slides was also done with higher magnification, to detect early tumors. The box indicates the area shown in panel C. The arrow indicates the tumor seen in panel D. Scale bar = 1 mm. B: An early, intravillar adenoma with a single neoplastic gland. Scale bar = 100 µm. C: Adenomas of all sizes, from intravillar tumors to large adenomas. The upper, middle, and lower boxes indicate the areas shown in panels F, E, and B, respectively. Scale bar = 1 mm. D: A large colon tumor. Scale bar = 1 mm. E: A small adenoma, defined as seen on only one section. Scale bar = 100 µm. F: A large adenoma, which was seen in 5 sections. Scale bar = 1 mm.
FIG. 5
FIG. 5
Numbers of adenomas in ApcMin/+ mice on a 1% niacin diet and controls. A: Data for female and male mice combined. B: Female mice. C: Male mice. D: Colon tumors for male and female mice combined. Horizontal bars indicate medians. * indicates P < 0.05.

References

    1. Vosper H. Niacin: a re-emerging pharmaceutical for the treatment of dyslipidaemia. Br J Pharmacol. 2009;158:429–441. - PMC - PubMed
    1. Offermanns S. The nicotinic acid receptor GPR109A (HM74A or PUMA-G) as a new therapeutic target. Trends Pharmacol Sci. 2006;27:384–390. - PubMed
    1. Shah S, Ceska R, Gil-Extremera B, Paolini JF, Giezek H, et al. Efficacy and safety of extended-release niacin/laropiprant plus statin vs. doubling the dose of statin in patients with primary hypercholesterolaemia or mixed dyslipidaemia. Int J Clin Pract. 2010;64:727–738. - PubMed
    1. Morrow JD, Parsons WG, III, Roberts LJ., II Release of markedly increased quantities of prostaglandin D2 in vivo in humans following the administration of nicotinic acid. Prostaglandins. 1989;38:263–274. - PubMed
    1. Morrow JD, Awad JA, Oates JA, Roberts LJ., II Identification of skin as a major site of prostaglandin D2 release following oral administration of niacin in humans. J Invest Dermatol. 1992;98:812–815. - PubMed

Publication types

MeSH terms

LinkOut - more resources