. 2011 Oct;85(19):9854-62.
doi: 10.1128/JVI.00788-11. Epub 2011 Jul 20.

DNA/NYVAC vaccine regimen induces HIV-specific CD4 and CD8 T-cell responses in intestinal mucosa

Affiliations

DNA/NYVAC vaccine regimen induces HIV-specific CD4 and CD8 T-cell responses in intestinal mucosa

Matthieu Perreau et al. J Virol. 2011 Oct.

Abstract

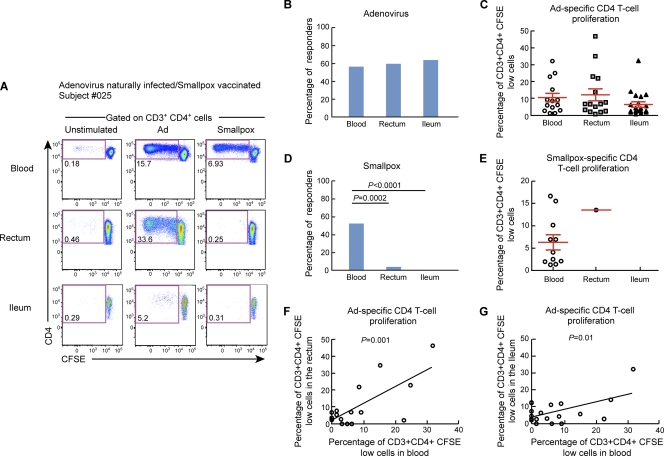
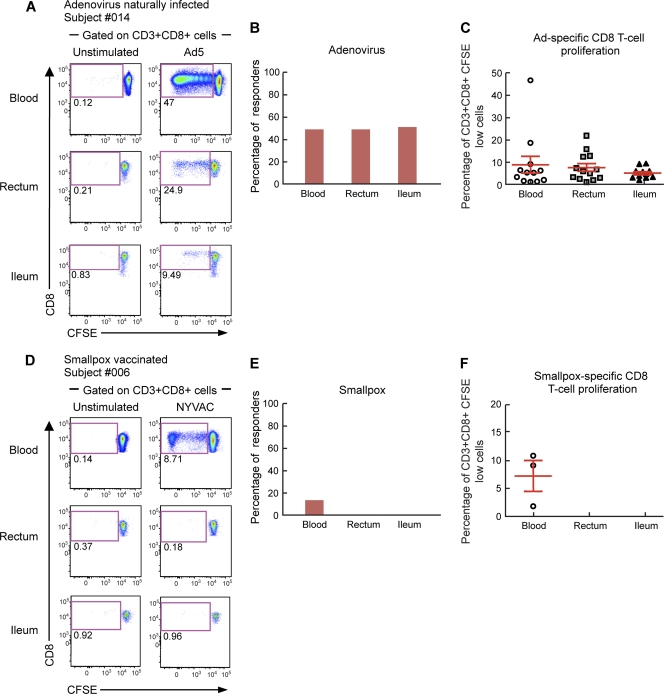
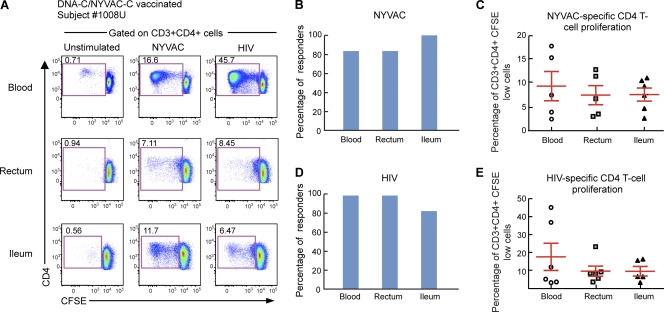
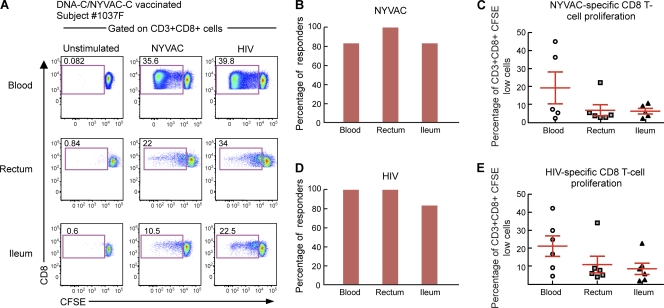
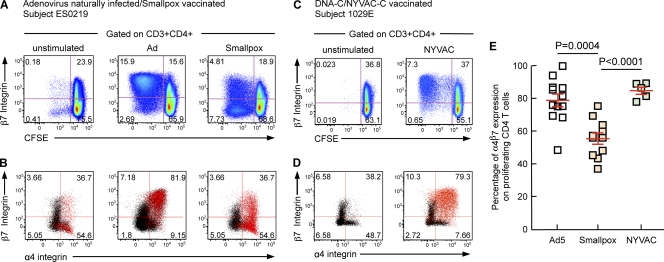
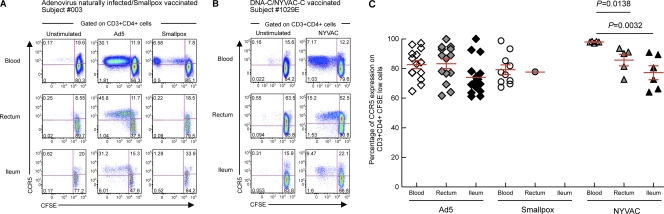
In the present study, we have investigated the anatomic distribution in blood and gut mucosal tissues of memory poxvirus-specific CD4 and CD8 T cells in subjects vaccinated with smallpox and compared it with vector (NYVAC)-specific and HIV insert-specific T-cell responses induced by an experimental DNA-C/ NYVAC-C vaccine regimen. Smallpox-specific CD4 T-cell responses were present in the blood of 52% of the subjects studied, while smallpox-specific CD8 T cells were rarely detected (12%). With one exception, smallpox-specific T cells were not measurable in gut tissues. Interestingly, NYVAC vector-specific and HIV-specific CD4 and CD8 T-cell responses were detected in almost 100% of the subjects immunized with DNA-C/NYVAC-C in blood and gut tissues. The large majority (83%) of NYVAC-specific CD4 T cells expressed α4β7 integrins and the HIV coreceptor CCR5. These results demonstrate that the experimental DNA-C/NYVAC-C HIV vaccine regimen induces the homing of potentially protective HIV-specific CD4 and CD8 T cells in the gut, the port of entry of HIV and one of the major sites for HIV spreading and the depletion of CD4 T cells.


Figures

Fig. 1.
Fig. 1.
Adenovirus-specific but not smallpox-specific CD4 T cells are detected in gut mucosal tissues. Mononuclear cells were isolated from blood and gut mucosal tissues (rectum and ileum), stained with CFSE, and stimulated with Ad5 or NYVAC vectors. Following 6 days of incubation, cells were stained with CD3, CD4, and CD8 MAbs. (A) Flow cytometric profiles of proliferating Ad-specific and smallpox-specific CD4 T cells from mononuclear cells isolated from blood and mucosal tissues (rectum and ileum). Data from one representative subject (subject 025) are shown. The flow cytometric profile of unstimulated cells (negative control) is also shown. (B and C) Percentages of Ad-specific (B) and smallpox-specific (C) CD4 T-cell responders (volunteers with CD4 T-cell responses). (D and E) Frequencies of proliferating Ad-specific (D) and smallpox-specific (E) CD4 T cells. (F and G) Direct correlation between Ad-specific CD4 T-cell proliferation detected in blood and the rectum (F) or the ileum (G). Statistical analyses were performed by using chi-square methods for comparisons of positive proportions, a Student t test for multiple comparisons, or a Spearman rank test for correlations.
Fig. 2.
Fig. 2.
Adenovirus-specific but not smallpox-specific CD8 T cells are detected in gut mucosal tissues. Mononuclear cells were isolated from blood and gut mucosal tissues (rectum and ileum), stained with CFSE, and stimulated with Ad5 or NYVAC vectors. Following 6 days of incubation, cells were stained with CD3, CD4, and CD8 MAbs. (A and D) Flow cytometric profiles of proliferating Ad-specific (A) and smallpox-specific (D) CD8 T cells from mononuclear cells isolated from blood and mucosal tissues (rectum and ileum). Data from two representative subjects (subject 014 and 006) are shown. The flow cytometric profiles of unstimulated cells (negative control) are also shown. (B and C) Percentages of Ad-specific (B) and smallpox-specific (C) CD8 T-cell responders (volunteers with CD8 T-cell responses). (E and F) Frequencies of proliferating Ad-specific (E) and smallpox-specific (F) CD8 T cells. Statistical analyses were performed by using chi-square methods for comparisons of positive proportions and a Student t test for multiple comparisons.
Fig. 3.
Fig. 3.
Frequencies of Ad-specific CD4 T cells in blood and in mucosal tissues do not correlate with Ad5-specific neutralizing antibody titers. Ad5-NAb titers were determined for each volunteer as described in Materials and Methods. The volunteers were arbitrarily stratified by their Ad5 serostatus into two groups: Ad5-NAb low (Ad5-NAb titers of <18; n = 12) and Ad5-NAb high (Ad5-NAb titers of >18; n = 13). The percentages of Ad-specific CD4 T-cell responders (volunteers with Ad-specific CD4 T-cell proliferation) were compared in volunteers with low and high Ad5-NAb titers for each compartment: peripheral blood (A), rectum (B), and ileum (C). Statistical analyses were performed by using chi-square methods for comparisons of positive proportions.
Fig. 4.
Fig. 4.
NYVAC-specific and HIV-specific CD4 T cells home to gut mucosal tissues. Mononuclear cells were isolated from blood and gut mucosal tissues (rectum and ileum) of subjects (n = 6) vaccinated with the DNA-C/NYVAC-C regimen in the EV03 study, stained with CFSE, and stimulated with NYVAC empty vectors or HIV peptide pools encompassing the Env, Gag, Pol, and Nef regions. Following 6 days of incubation, cells were stained with CD3, CD4, and CD8 MAbs. (A) Flow cytometric profiles of proliferating NYVAC-specific and HIV-specific CD4 T cells in mononuclear cells isolated from blood and mucosal tissues (rectum and ileum). Data from one representative subject (subject 1008U) are shown. The flow cytometric profiles of unstimulated cells (negative control) are also shown. (B and C) Percentage of NYVAC-specific (B) or HIV-specific (C) responders (volunteers with CD4 T-cell responses). (D and E) Frequencies of proliferating NYVAC-specific (D) or HIV-specific (E) CD4 T cells. Statistical analyses were performed by using chi-square methods for comparisons of positive proportions or by a Student t test in the case of multiple comparisons.
Fig. 5.
Fig. 5.
NYVAC-specific and HIV-specific CD8 T cells home to gut mucosal tissues. Mononuclear cells were isolated from blood and gut mucosal tissues (rectum and ileum) of subjects (n = 6) vaccinated with the DNA-C/NYVAC-C regimen in the EV03 study, stained with CFSE, and stimulated with NYVAC empty vectors or HIV peptide pools encompassing the Gag, Pol, Nef, and Env regions. Following 6 days of incubation, cells were stained with CD3, CD4, and CD8 MAbs. (A) Flow cytometric profiles of proliferating NYVAC-specific and HIV-specific CD8 T cells in mononuclear cells isolated from blood and mucosal tissues (rectum and ileum). Data from one representative subject (subject 1037F) are shown. The flow cytometric profiles of unstimulated cells (negative control) are also shown. (B and C) Percentage of NYVAC-specific (B) or HIV-specific (C) responders (volunteers with CD8 T-cell responses). (D and E) Frequencies of proliferating NYVAC-specific (D) or HIV-specific (E) CD8 T cells. Statistical analyses were performed by using chi-square methods for comparisons of positive proportions or by a Student t test in the case of multiple comparisons.
Fig. 6.
Fig. 6.
Adenovirus-specific and NYVAC-specific CD4 T cells express higher levels of α4β7 integrins than do smallpox-specific CD4 T cells. Mononuclear cells were isolated from blood, stained with CFSE, and stimulated with Ad5 or NYVAC vectors. Following 6 days of incubation, cells were stained with CD3, CD4, CD8, and α4/β7 integrin MAbs. (A to D) Flow cytometric profiles of proliferating Ad-specific (A and B), smallpox-specific (A and B), and NYVAC-specific (C and D) CD4 T cells (CFSE-low cells) expressing β7 integrin or coexpressing α4 and β7 integrins. Black dots correspond to CD3+ CD4+ CFSE-high cells, and red dots correspond to CD3+ CD4+ CFSE-low cells. (E) Cumulative data for proliferating Ad-specific, smallpox-specific, or NYVAC-specific CD4 T cells (CD4 CFSE-low cells) expressing α4β7 integrins.
Fig. 7.
Fig. 7.
Proliferating Ad-specific, smallpox-specific, and NYVAC-specific CD4 T cells express high levels of HIV coreceptor CCR5. Mononuclear cells were isolated from peripheral blood and gut mucosal tissues (rectum and ileum), stained with CFSE, and stimulated with Ad5 or NYVAC vectors. Following 6 days of incubation, cells were stained with CD3, CD4, CD8, and CCR5 MAbs. (A and B) Flow cytometric profiles of proliferating (CFSE-low cells) Ad-specific (A), smallpox-specific (A), and NYVAC-specific (B) CD4 T cells in mononuclear cells isolated from blood and mucosal tissues (rectum and ileum) expressing CCR5. Two representative subjects (subjects 003 and 1029E) are shown. The flow cytometric profiles of unstimulated cells (negative control) are also shown. (C) Percentage of Ad-specific, smallpox-specific, and NYVAC-specific CD4 T cells (CD3+ CD4+ CFSE-low cells) expressing CCR5. P values were determined by using a Student t test.

References

    1. Bart P. A., et al. 2008. EV01: a phase I trial in healthy HIV negative volunteers to evaluate a clade C HIV vaccine, NYVAC-C undertaken by the EuroVacc Consortium. Vaccine 26:3153–3161 - PubMed
    1. Benlahrech A., et al. 2009. Adenovirus vector vaccination induces expansion of memory CD4 T cells with a mucosal homing phenotype that are readily susceptible to HIV-1. Proc. Natl. Acad. Sci. U. S. A. 106:19940–19945 - PMC - PubMed
    1. Berlin C., et al. 1993. Alpha 4 beta 7 integrin mediates lymphocyte binding to the mucosal vascular addressin MAdCAM-1. Cell 74:185–195 - PubMed
    1. Brenchley J. M., Douek D. C. 2008. HIV infection and the gastrointestinal immune system. Mucosal Immunol. 1:23–30 - PMC - PubMed
    1. Brenchley J. M., et al. 2004. CD4+ T cell depletion during all stages of HIV disease occurs predominantly in the gastrointestinal tract. J. Exp. Med. 200:749–759 - PMC - PubMed

Publication types

MeSH terms