. 2011 Sep;17(9):1697-712.
doi: 10.1261/rna.2799511. Epub 2011 Jul 20.

RNA-ligase-dependent biases in miRNA representation in deep-sequenced small RNA cDNA libraries

Affiliations

RNA-ligase-dependent biases in miRNA representation in deep-sequenced small RNA cDNA libraries

Markus Hafner et al. RNA. 2011 Sep.

Abstract

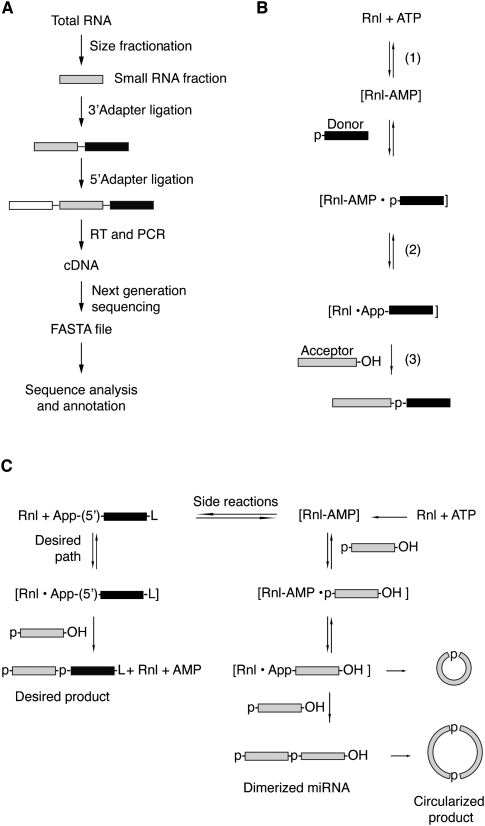
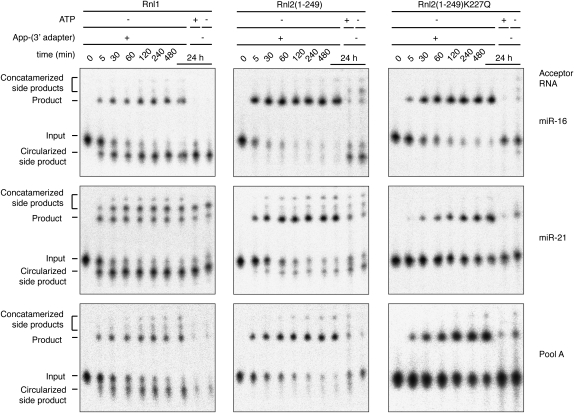
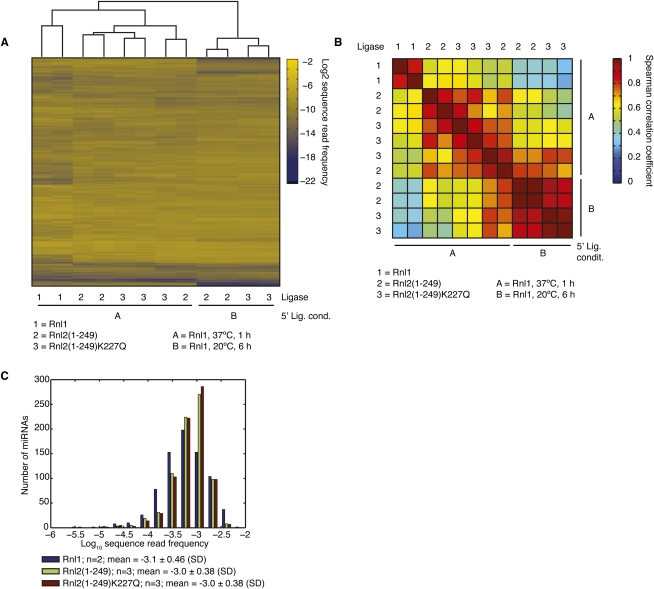
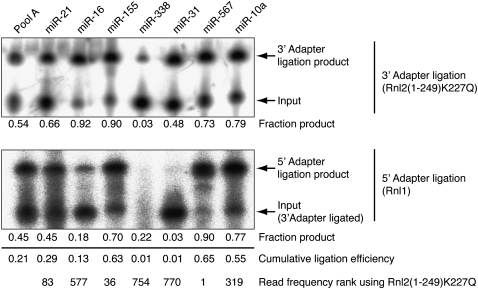
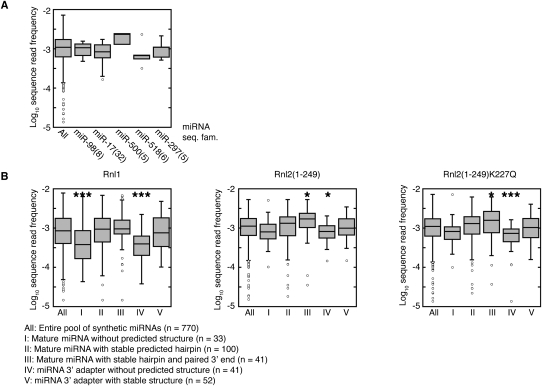
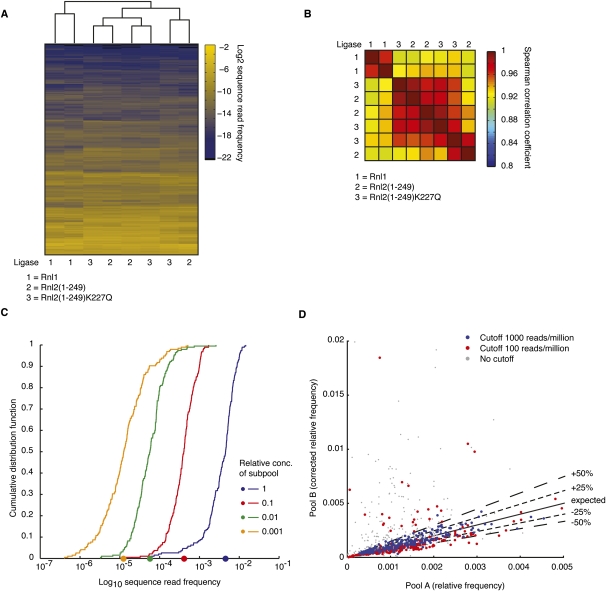
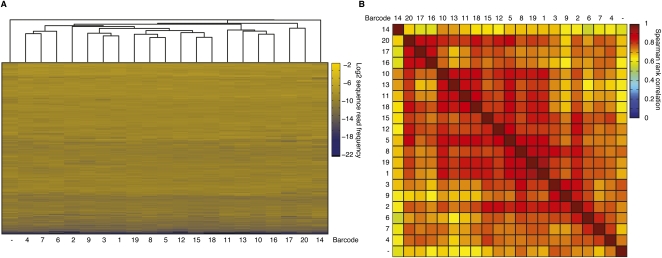
Sequencing of small RNA cDNA libraries is an important tool for the discovery of new RNAs and the analysis of their mutational status as well as expression changes across samples. It requires multiple enzyme-catalyzed steps, including sequential oligonucleotide adapter ligations to the 3' and 5' ends of the small RNAs, reverse transcription (RT), and PCR. We assessed biases in representation of miRNAs relative to their input concentration, using a pool of 770 synthetic miRNAs and 45 calibrator oligoribonucleotides, and tested the influence of Rnl1 and two variants of Rnl2, Rnl2(1-249) and Rnl2(1-249)K227Q, for 3'-adapter ligation. The use of the Rnl2 variants for adapter ligations yielded substantially fewer side products compared with Rnl1; however, the benefits of using Rnl2 remained largely obscured by additional biases in the 5'-adapter ligation step; RT and PCR steps did not have a significant impact on read frequencies. Intramolecular secondary structures of miRNA and/or miRNA/3'-adapter products contributed to these biases, which were highly reproducible under defined experimental conditions. We used the synthetic miRNA cocktail to derive correction factors for approximation of the absolute levels of individual miRNAs in biological samples. Finally, we evaluated the influence of 5'-terminal 5-nt barcode extensions for a set of 20 barcoded 3' adapters and observed similar biases in miRNA read distribution, thereby enabling cost-saving multiplex analysis for large-scale miRNA profiling.


Figures

FIGURE 1.
FIGURE 1.
Scheme of the reactions for the small RNA cDNA library preparation. (A) Overview of the workflow for the generation of small RNA profiles by cDNA library sequencing. (B) Ligation reaction catalyzed by RNA ligases involving three nucleotidyl transfer steps: (1) the ligase forms a covalent Rnl-(lysyl-N)-AMP intermediate from ATP; (2) the AMP is subsequently transferred to the 5′ P of the donor RNA (black box) to form an RNA-adenylate (AppRNA); and (3) the 3′-OH of the acceptor RNA (light gray box) attacks the AppRNA, releasing AMP and forming a molecule where the donor RNA is ligated to the 3′ end of the acceptor RNA. (C) Reactions taking place in the 3′-adapter ligation step using RNA ligases 1 and 2 and 5′ pre-adenylylated adapters in the absence of ATP leading to the desired adapter ligated small RNA (left panel) or the undesired circularized or concatamerized small RNA products by adenylate transfer.
FIGURE 2.
FIGURE 2.
Comparison of 3′-adapter ligation by three RNA ligases. 5′-32P-radiolabeled oligoribonucleotides (miR-16, miR-21, and a pool containing 770 different miRNAs) were reacted in the absence of ATP with a pre-adenylylated adapter oligodeoxyribonucleotide on ice for the indicated time using either Rnl1 (left panels), the truncated Rnl2(1–249) (middle panels), and the truncated and mutated Rnl2(1–249)K227Q (right panels). To monitor the progress of the reaction, samples for each time point were fractionated by denaturing gel electrophoresis on a 15% denaturing polyacrylamide gel and visualized by phosphorimaging. The different reaction products and the input are marked. Control reactions in the presence of ATP and in the absence of the adapter were included. The experiments were performed in triplicate, and a representative phosphorimage picture is shown.
FIGURE 3.
FIGURE 3.
miRNA representation by sequencing varies by three orders of magnitude and is dependent on the structure of the mature miRNA and miRNA-adapter product. (A) Unsupervised hierarchical clustering of miRNA profiles derived from cDNA libraries generated from the pool of 815 oligoribonucleotides present in equimolar concentrations (pool A, Supplemental Table 1) using Rnl1, Rnl2(1–249), and Rnl2(1–249)K227Q for the 3′-adapter ligation step and sequenced by Solexa next-generation sequencing platform. (B) Pairwise comparison of Spearman rank correlation coefficients of the miRNA profiles from A. (C) Distribution of average sequence read frequencies of the 770 miRNAs present in equimolar concentrations in pool A in cDNA libraries generated using Rnl1, Rnl2(1–249), and Rnl2(1–249)K227Q in the 3′-adapter ligation step. The number of biological replicates for each distribution is indicated. miRNA relative frequencies vary by 1000-fold.
FIGURE 4.
FIGURE 4.
5′-Adapter ligation introduces sequence-specific biases. Autoradiographs of the 3′-adapter ligation step using Rnl2(1–249)K227Q with 5′-32P-radiolabeled oligoribonucleotide sequences shown in Supplemental Table 1 (upper panel), the products of which were purified and used as input into the 5′-adapter ligation step using Rnl1 (lower panel). The fraction of adapter-ligated material was calculated from the ratio of intensity of the product band and the sum of the intensities of input and product band. The cumulative adapter ligation efficiencies are indicated.
FIGURE 5.
FIGURE 5.
miRNA representation is influenced by folding. (A) Members of the same miRNA sequence families are represented with similar sequence read frequencies. The log-transformed sequence-read frequencies for the indicated sequence families (see Supplemental Table 7 for miRNA sequence family classification) are compared with the distribution of sequence reads for the entire pool. Sequence families are named after the member with the lowest number; the number of members in the sequence family are in brackets. Results are shown for the experiments using Rnl2(1–249)K227Q in the 3′-adapter ligation; the experiments using the other ligases yielded similar results (data not shown). (B) miRNA representation depends on structure. miRNAs present in the pool were classified according to their predicted structure: (I) mature miRNA without predicted structure; (II) mature miRNA folds into stable structure with at least 14 paired bases; (III) same as II, in addition, the 3′ end is paired; (IV) miRNA-3′-adapter-ligation product has weak predicted structure (less than nine paired bases); and (V) miRNA-3′-adapter ligation product has strong predicted structure with more than 28 paired bases. The log-transformed sequence-read frequencies of the individual categories were compared with the distribution of sequence reads for the entire pool, and the statistical significance of the difference between the populations was calculated; two-tailed t-test, (*) p < 0.05; (**) p < 0.01; (***) p < 0.001.
FIGURE 6.
FIGURE 6.
miRNA profiles generated by sequencing are able to reflect relative differences in miRNAs of approximately three orders of magnitude. (A) miRNA profiles derived from individual cDNA libraries generated from the pool of 770 oligoribonucleotides divided into four subpools present in concentrations spanning three orders of magnitude (pool B, Supplemental Table 2) using Rnl1, Rnl2(1–249), and Rnl2(1–249)K227Q for the 3′-adapter ligation step and sequenced either on a 454 or Solexa next-generation sequencing platform were subjected to unsupervised hierarchical clustering. (B) Pairwise comparison of Spearman rank correlation coefficients of the miRNA profiles clustered in A. (C) Increased sequencing depth makes relative comparison between samples of miRNAs present in very different concentrations more reliable. Sequence read frequencies of miRNAs from pool B and Rnl2(1–249)K227Q in the 3′-adapter ligation step were sorted according to the four subpools (Supplemental Table 2) making up pool B and their cumulative distribution function plotted for the Solexa-sequenced libraries. The same plot for 454-sequenced cDNA libraries is appended to Supplemental Table 9. The median sequence read frequency of each subpool is indicated on the x-axis. (D) Sequence read frequencies for the Solexa-sequenced cDNA libraries from C were corrected by the known input concentration from pool B and plotted against the sequence read frequencies from pool A. Blue dots are miRNAs sequenced with at least 1000 reads per million in pool B; red dots with at least 100 reads per million; and gray dots without cutoff. The full line denotes the expected corrected values, the dashed lines an error margin of 25% and 50%, respectively.
FIGURE 7.
FIGURE 7.
Barcoded 3′-adapters allow multiplexed miRNA profiling. (A) Unsupervised hierarchical clustering of miRNA profiles derived from cDNA libraries generated from pool A in Supplemental Table 1 using Rnl2(1–249)K227Q for the 3′-adapter ligation step with a panel of 20 chemically adenylylated 3′-adapter oligonucleotides bearing a pentameric barcode sequence at their 5′ end. Samples were pooled after 3′-adapter ligation and subjected to standard 5′-adapter ligation, RT and PCR. (B) Pairwise comparison of Spearman rank correlation coefficients of the miRNA profiles from A.

Similar articles

Cited by

References

    1. Alefelder S, Patel BK, Eckstein F 1998. Incorporation of terminal phosphorothioates into oligonucleotides. Nucleic Acids Res 26: 4983–4988 - PMC - PubMed
    1. Aravin AA, Tuschl T 2005. Identification and characterization of small RNAs involved in RNA silencing. FEBS Lett 579: 5830–5840 - PubMed
    1. Bartel DP 2009. MicroRNAs: Target recognition and regulatory functions. Cell 136: 215–233 - PMC - PubMed
    1. Berninger P, Gaidatzis D, van Nimwegen E, Zavolan M 2008. Computational analysis of small RNA cloning data. Methods 44: 13–21 - PubMed
    1. Bhattacharyya SN, Filipowicz W 2007. Argonautes and company: Sailing against the wind. Cell 128: 1027–1028 - PubMed

Publication types