. 2011 Sep 1;71(17):5806-17.
doi: 10.1158/0008-5472.CAN-11-0025. Epub 2011 Jul 20.

Modulating microtubule stability enhances the cytotoxic response of cancer cells to Paclitaxel

Affiliations

Modulating microtubule stability enhances the cytotoxic response of cancer cells to Paclitaxel

Ahmed Ashour Ahmed et al. Cancer Res. .

Abstract

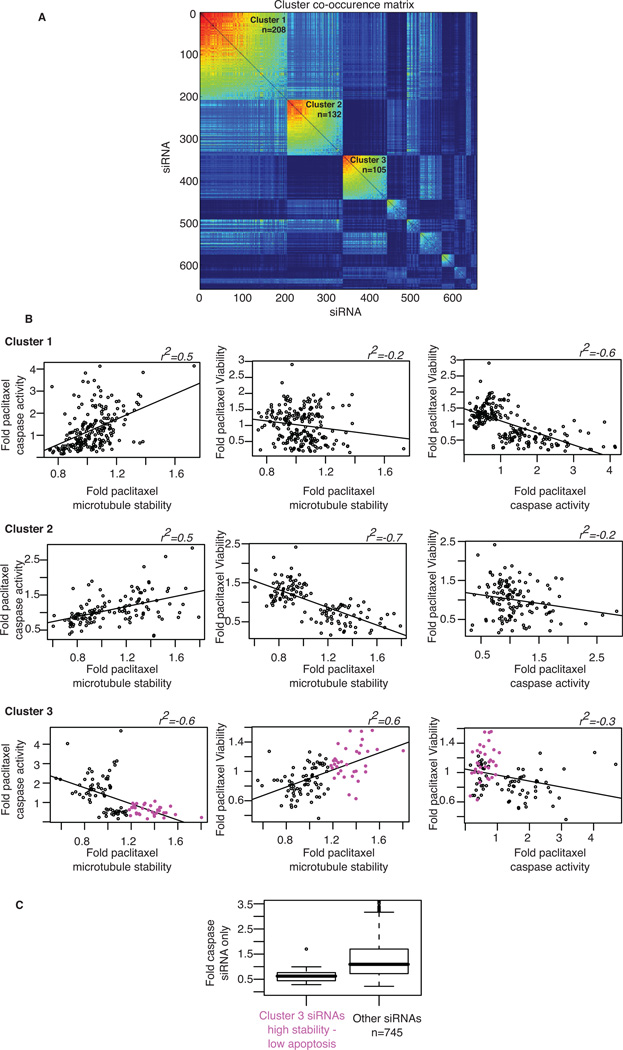
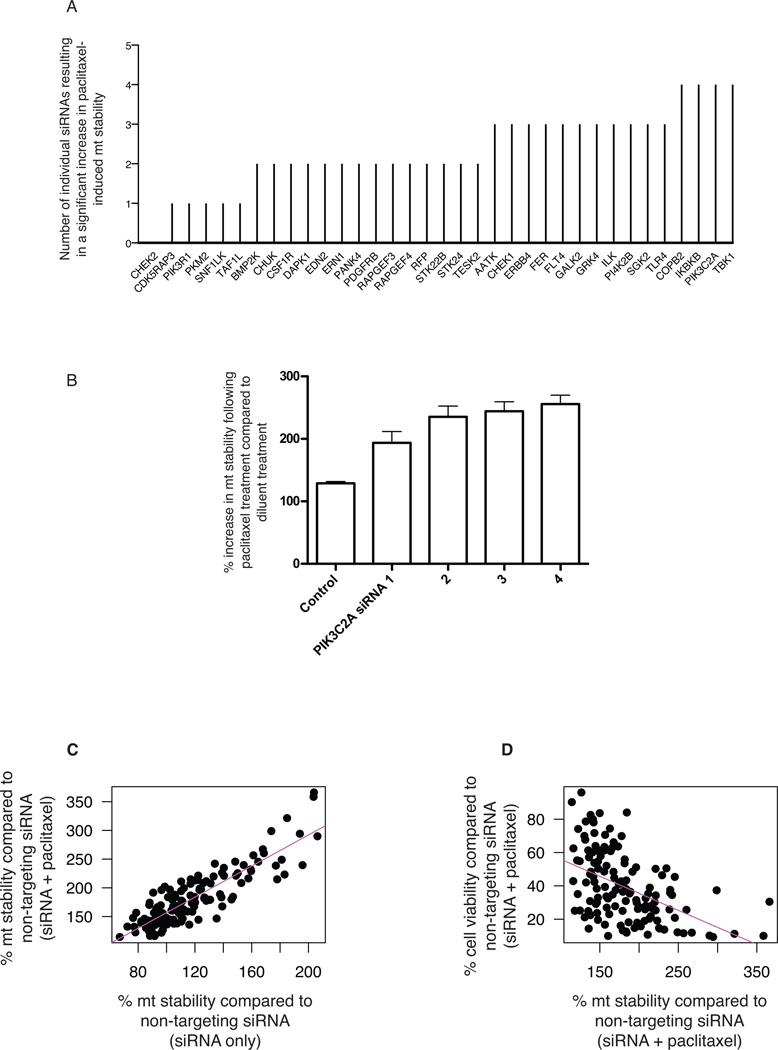
The extracellular matrix protein TGFBI enhances the cytotoxic response of cancer cells to paclitaxel by affecting integrin signals that stabilize microtubules. Extending the implications of this knowledge, we tested the more general hypothesis that cancer cell signals which increase microtubule stability before exposure to paclitaxel may increase its ability to stabilize microtubules and thereby enhance its cytotoxicity. Toward this end, we carried out an siRNA screen to evaluate how genetic depletion affected microtubule stabilization, cell viability, and apoptosis. High content microscopic analysis was carried out in the absence or presence of paclitaxel. Kinase knockdowns that stabilized microtubules strongly enhanced the effects of paclitaxel treatment. Conversely, kinase knockdowns that enhanced paclitaxel-mediated cytotoxicity sensitized cells to microtubule stabilization by paclitaxel. The siRNA screen identified several genes that have not been linked previously to microtubule regulation or paclitaxel response. Gene shaving and Bayesian resampling used to classify these genes suggested three pathways of paclitaxel-induced cell death related to apoptosis and microtubule stability, apoptosis alone, or neither process. Our results offer a functional classification of the genetic basis for paclitaxel sensitivity and they support the hypothesis that stabilizing microtubules prior to therapy could enhance antitumor responses to paclitaxel treatment.


Conflict of interest statement

Potential conflicts of interest: None declared

Figures

Figure 1
Figure 1. A hypothesis-driven screen to investigate the influence of baseline microtubule stability of paclitaxel cytotoxicity
A) An outline of the siRNA screens conducted. The 779 siRNA pools used in each screen were divided into three 384-well plates (320 pools for plates 1 and 2 and 139 pools in plate 3) and three replicates were used for each plate with and without paclitaxel giving a total of 54 384-well plates for the entire experiment. B) Shown in the lower diagonal of each plot are dot plots representing the correlation between the measures obtained for each pair of the three replicates used in the screen following paclitaxel treatment. The corresponding Pearson correlation coefficient for each pair is shown in the upper diagonal of each plot.
Figure 2
Figure 2. Baseline microtubule stability strongly correlates with paclitaxel-induced microtubule stabilization
779 siRNA pools targeting individual genes were used to transfect SKOv3 cells followed by immunofluorescence as described in methods. The mean cytoplasmic pixel intensity values for each cell were extracted and background subtracted using the In-Cell Investigator (GE Healthcare) software from a total of 64,800 images including a total of ~ 4 million cells. The mean value of all cells in a well, that represent a single gene, was used to calculate the percentage microtubule stability following knockdown of a gene compared to the mean value obtained for non-targeting siRNA transfected cells. In this plot each circle represents the median of triplicate percentage values obtained following siRNA treatment alone, representing baseline microtubule stability, or siRNA and paclitaxel treatment.
Figure 3
Figure 3. Enhanced microtubule stabilization is a significant mechanism for enhanced paclitaxel-mediated cytotoxicity
SKOv3 cells were treansfected, and treated as described in figure 1 and methods. After this, the following parameters were measured; 1) the fold change in apoptosis or cytotoxicity following siRNA pool transfection alone compared to non-targeting siRNA (fold no drug), 2) the fold change in apoptosis or cytotoxicity following siRNA pool transfection and paclitaxel compared to non-targeting siRNA transfection and paclitaxel (fold drug treated) and 3) the ratio of 2 over 1. siRNA pools were identified that either increased the fold drug treated over 2.5 or increased the ratio over 2. In the figure, each circle represents the median of triplicate values of the indicated ratio. Data for apoptosis and cell viability is presented in (A) and (B), respectively. The blue lines indicate the cut-offs used in the screen for identifying hits. The green circles indicate genes that also enhanced paclitaxel-induced microtubule stability.
Figure 4
Figure 4. Measuring microtubule stability identifies three distinct mechanistic classes for modulating paclitaxel-induced cytotoxicity
A cluster co-occurrence matrix showing the results of gene clustering (from 1 to 779) following permutation analysis based on the similarity between genes in modulating paclitaxel-induced cytotoxicity, apoptosis and microtubule stabilization. In this figure, red signifies high similarity and dark blue signifies no similarity. This analysis identified three main gene clusters. In B, the pair-wise correlation between the fold change in microtubule stability, apoptosis and cell viability following siRNA and paclitaxel treatments. Note the good correlation between microtubule stability and apoptosis and viability for cluster 2, the good correlation between microtubule stability and apoptosis for cluster 1 and the paradoxical inverse correlation between microtubule stability and cell viability and apoptosis for cluster 3. In cluster 3 circles in magenta represent genes that upon depletion increase microtubule stability but paradoxically decrease apoptosis and improve cell viability following paclitaxel treatment. In C, a box plot is presented to compare the fold change in apoptosis following siRNA-mediated depletion of genes shown in magenta in cluster 3 (n=34) with the rest of the genes (n = 745). Note that for this cluster of 34 genes, siRNA depletion results in a significant decrease in apoptosis irrespective of paclitaxel treatment.
Figure 5
Figure 5. Secondary validation identifies novel mechanisms of modulating microtubule stability and paclitaxel cytotoxicity
A) SKOv3 cells were transfected as described in methods followed by treatment using diluent or paclitaxel as in the primary screen followed by immunofluorescence to measure microtubule stability. The bar plot shows the number of siRNAs per gene that significantly (p<0.05) enhanced paclitaxel-induced microtubule stability. In B, an example of increased % of paclitaxel-induced microtubule stability following depletion of PIK3C2A using 4 individual siRNAs compared to non-targeting siRNA-transfected (control), paclitaxel-treated cells. Shown is the mean + s.d. of triplicate measurements for each siRNA used. C) Same experiment as in A. Shown is the correlation between baseline microtubule stability following siRNA transfection alone and microtubule stability following siRNA transfection and paclitaxel treatment. D) In parallel to the secondary validation described in A, an additional secondary validation was performed to measure cell viability 72 hrs following paclitaxel treatment in a similar way to that used in the primary screen. Shown is the correlation between the percentage of microtubule stability and the percentage of cell viability following siRNA transfection and paclitaxel treatment.
Figure 6
Figure 6. Modulating microtubule stability directly influences microtubule mass and cytotoxicity in ovarian cancer cell lines
A–B) SKOv3 cells were transfected using the indicated siRNAs for 48 hrs then treated with paclitaxel for one hour using the indicated concentrations then fixed and probed using anti-Glu tubulin counterstained with alexa-594 (A) or anti-α tubulin counterstained with alexa-488 (B). Images were collected and segmented as previously described. Shown in the mean background- (BG-) subtracted intensity +/− s.e.m. for each stain. C–D) Cells were transfected using either non-targeting siRNA or siRNAs targeting ILK (C) or RAPGEF4 (D) for 48 hrs then treated with paclitaxel 1nM for 48 hrs and cells were maintained for either 4 days (Hey cells) or 7 days (SKOv3 cells) then fixed and stained using Coomassie Blue and individual colonies were counted. Shown is the mean number of colonies +/− s.d. of counts from two independent experiments.

References

    1. Schiff PB, Horwitz SB. Taxol assembles tubulin in the absence of exogenous guanosine 5'-triphosphate or microtubule-associated proteins. Biochemistry. 1981;20:3247–3252. - PubMed
    1. Schiff PB, Horwitz SB. Taxol stabilizes microtubules in mouse fibroblast cells. Proc Natl Acad Sci U S A. 1980;77:1561–1565. - PMC - PubMed
    1. Martin M, Rodriguez-Lescure A, Ruiz A, Alba E, Calvo L, Ruiz-Borrego M, et al. Randomized phase 3 trial of fluorouracil, epirubicin, and cyclophosphamide alone or followed by Paclitaxel for early breast cancer. J Natl Cancer Inst. 2008;100:805–814. - PubMed
    1. McGuire WP, Hoskins WJ, Brady MF, Kucera PR, Partridge EE, Look KY, et al. Cyclophosphamide and cisplatin versus paclitaxel and cisplatin: a phase III randomized trial in patients with suboptimal stage III/IV ovarian cancer (from the Gynecologic Oncology Group) Semin Oncol. 1996;23:40–47. - PubMed
    1. Nogales E, Wolf SG, Khan IA, Luduena RF, Downing KH. Structure of tubulin at 6.5 A and location of the taxol-binding site. Nature. 1995;375:424–427. - PubMed

Publication types