. 2011 Jul 20;31(29):10437-44.
doi: 10.1523/JNEUROSCI.5590-10.2011.

Receptive field positions in area MT during slow eye movements

Affiliations

Receptive field positions in area MT during slow eye movements

Till S Hartmann et al. J Neurosci. .

Abstract

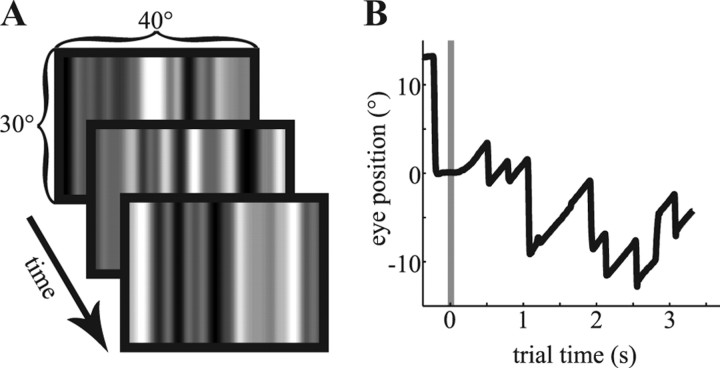
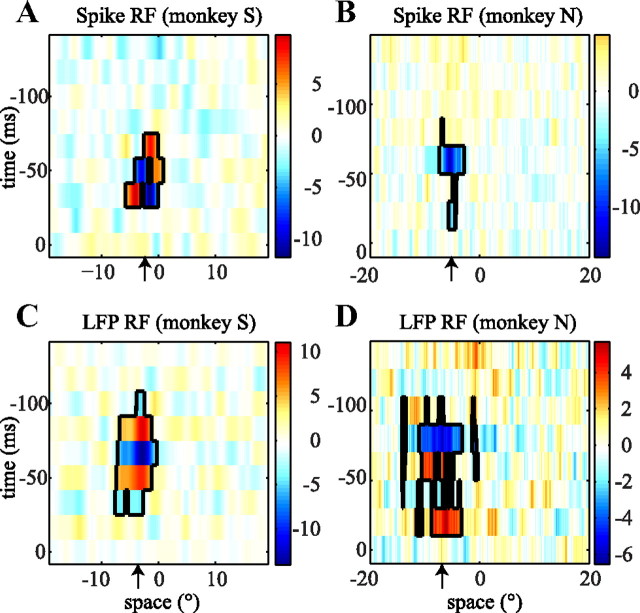
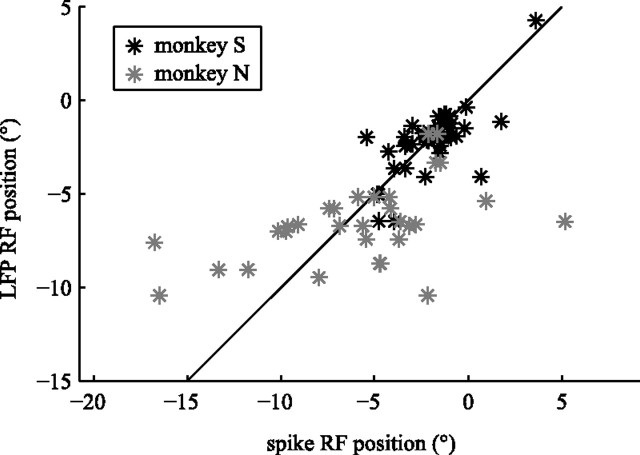
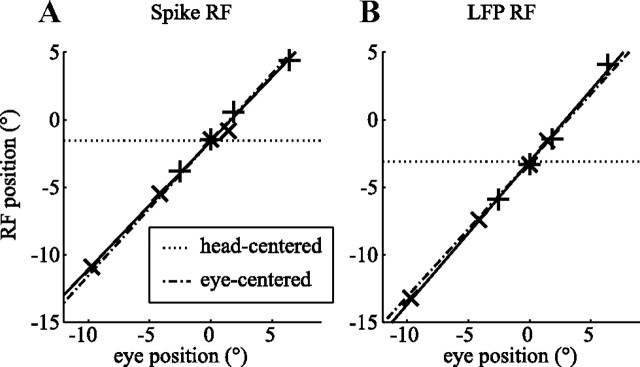
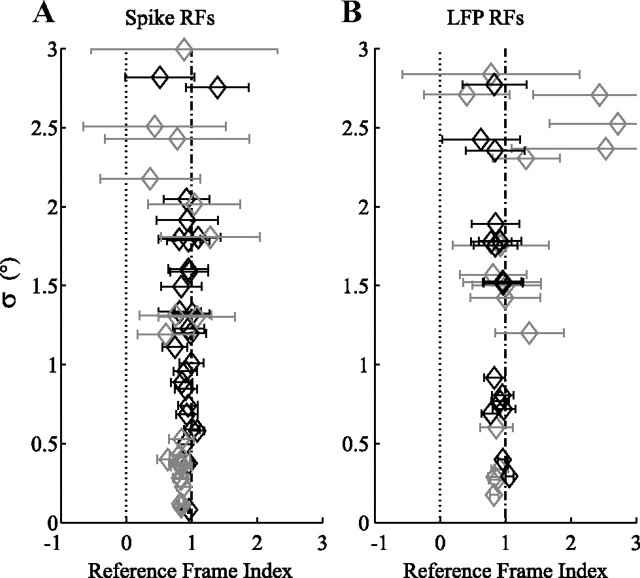
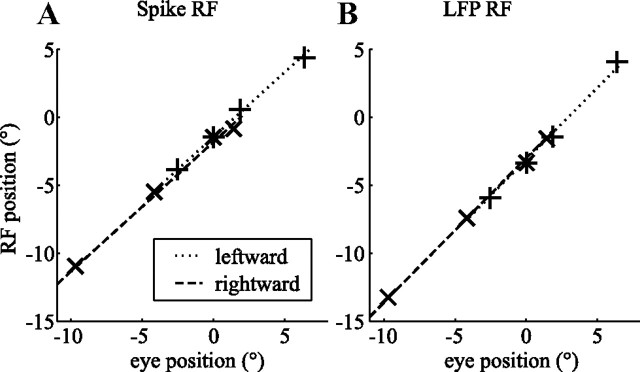
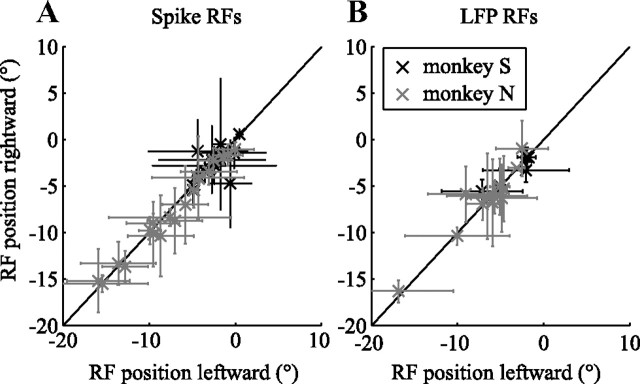
Perceptual stability requires the integration of information across eye movements. We first tested the hypothesis that motion signals are integrated by neurons whose receptive fields (RFs) do not move with the eye but stay fixed in the world. Specifically, we measured the RF properties of neurons in the middle temporal area (MT) of macaques (Macaca mulatta) during the slow phase of optokinetic nystagmus. Using a novel method to estimate RF locations for both spikes and local field potentials, we found that the location on the retina that changed spike rates or local field potentials did not change with eye position; RFs moved with the eye. Second, we tested the hypothesis that neurons link information across eye positions by remapping the retinal location of their RFs to future locations. To test this, we compared RF locations during leftward and rightward slow phases of optokinetic nystagmus. We found no evidence for remapping during slow eye movements; the RF location was not affected by eye-movement direction. Together, our results show that RFs of MT neurons and the aggregate activity reflected in local field potentials are yoked to the eye during slow eye movements. This implies that individual MT neurons do not integrate sensory information from a single position in the world across eye movements. Future research will have to determine whether such integration, and the construction of perceptual stability, takes place in the form of a distributed population code in eye-centered visual cortex or is deferred to downstream areas.


Figures

Figure 1.
Figure 1.
The random noise stimulus and a typical optokinetic eye movement. A, Three random noise patterns, as presented to monkey S. Each monitor frame consisted of one pattern similar to the ones shown here. B, A typical eye movement during the rightward OKN condition. Once the animal fixated a central dot, the flickering noise stimulus appeared on the screen. A random-dot pattern filling the entire screen replaced the central fixation dot at the same time, overlaying the flickering stimulus. This pattern moved with 10°/s and induced the OKN. The graph shows the initial saccade to the fixation point (0°), the onset of the moving dots and the random noise pattern (gray line), and the start of the slow phase of OKN followed by the typical saw-tooth pattern of the nystagmus.
Figure 2.
Figure 2.
Example RF maps. Each of the four images shows a spatiotemporal RF map. The axes are space (degrees), where 0 indicates the position of the fovea, and time (ms), where 0 is the time at which the neural data were recorded. The color represents luminance (z scored) and indicates the strength and sign of the RF. The black borders show the clusters in the space–time RF map that were significant (bootstrap test; see Materials and Methods). A, The spike RF of a single cell recorded in monkey S. B, The spike RF of a single cell from monkey N. C, D, The RF of the LFPs recorded at the same sites as the single cells in A and B, respectively. The black arrows indicate the estimated positions of the RFs. For a full description, see Results.
Figure 3.
Figure 3.
RF position correlation. The LFP RF position (vertical axis) is shown as a function of the spike RF positions (horizontal axis). Gray elements represent RFs from monkey N and black elements from monkey S. For both monkeys, LFP and spike RF position were significantly correlated.
Figure 4.
Figure 4.
RF reference frame estimation. The seven elements correspond to the seven independent pairs of eye position and RF position in screen coordinates (+, leftward slow phase; ×, rightward slow phase; *, fixation). The dash-dotted lines show the prediction of a pure eye-centered RF (RFI = 1). The dotted lines show the prediction of a head-centered RF (RFI = 0). The solid lines show the linear fit. A, RF location of a spike RF. B, RF location of the LFP RF from the same electrode (monkey N). These example recordings show receptive fields that clearly move with the eye.
Figure 5.
Figure 5.
Population overview of reference frames. A, RFI for all spike RFs (gray, monkey N; black, monkey S) with a goodness of fit (σ) better than 3° (for RFI and σ, see Materials and Methods). The horizontal bars on the data points show the confidence intervals for the estimates of the RFIs. B, RFIs for LFP RFs, same conventions as A. These data show that both spike and LFP RFs in MT moved with the eye.
Figure 6.
Figure 6.
Assessment of RF remapping during the slow phase of OKN. The seven elements correspond to the seven independent eye position/RF position pairs (+, leftward slow phase; ×, rightward slow phase; *, fixation). The lines in each plot correspond to two fits with the same slope to the rightward slow phase (dashed line) and the leftward slow phase (dotted line). The offsets of the fitted lines represent the retinal location of the RF when looking straight ahead. A, RF location based on spikes. B, RF location based on the LFP recorded from the same electrode (monkey N). The retinal locations of the RFs were not significantly different during leftward and rightward slow eye movements; there was no evidence for remapping in these example recordings.
Figure 7.
Figure 7.
Population overview of the (absence of) remapping. Error bars represent confidence intervals. Gray elements represent monkey N and black elements monkey S. A, The retinal RF position during rightward eye movements (vertical axis) compared with RF position during leftward eye movements (horizontal axis) for spike RFs. B, LFP RFs in the same format as A. For clarity, we excluded data in which the confidence intervals of the RF position estimates were bigger than 10°. These data show that the RF positions did not depend on the direction of the slow eye movement. Hence, MT RFs are not remapped during the following phase of OKN.

References

    1. Avillac M, Denève S, Olivier E, Pouget A, Duhamel JR. Reference frames for representing visual and tactile locations in parietal cortex. Nat Neurosci. 2005;8:941–949. - PubMed
    1. Bédard C, Kröger H, Destexhe A. Modeling extracellular field potentials and the frequency-filtering properties of extracellular space. Biophys J. 2004;86:1829–1842. - PMC - PubMed
    1. Burr DC, Morrone MC. Spatiotopic coding and remapping in humans. Philos Trans R Soc Lond B Biol Sci. 2011;366:504–515. - PMC - PubMed
    1. Chichilnisky EJ. A simple white noise analysis of neuronal light responses. Network. 2001;12:199–213. - PubMed
    1. Chukoskie L, Movshon JA. Modulation of visual signals in macaque MT and MST neurons during pursuit eye movement. J Neurophysiol. 2009;102:3225–3233. - PMC - PubMed

Publication types

LinkOut - more resources