. 2011 Jul 20;31(29):10615-26.
doi: 10.1523/JNEUROSCI.1805-11.2011.

Effect of sniffing on the temporal structure of mitral/tufted cell output from the olfactory bulb

Affiliations

Effect of sniffing on the temporal structure of mitral/tufted cell output from the olfactory bulb

Ryan M Carey et al. J Neurosci. .

Abstract

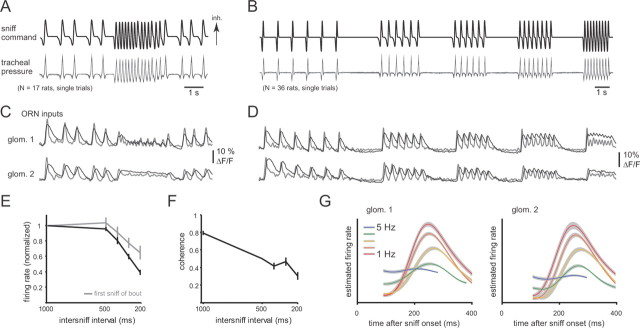
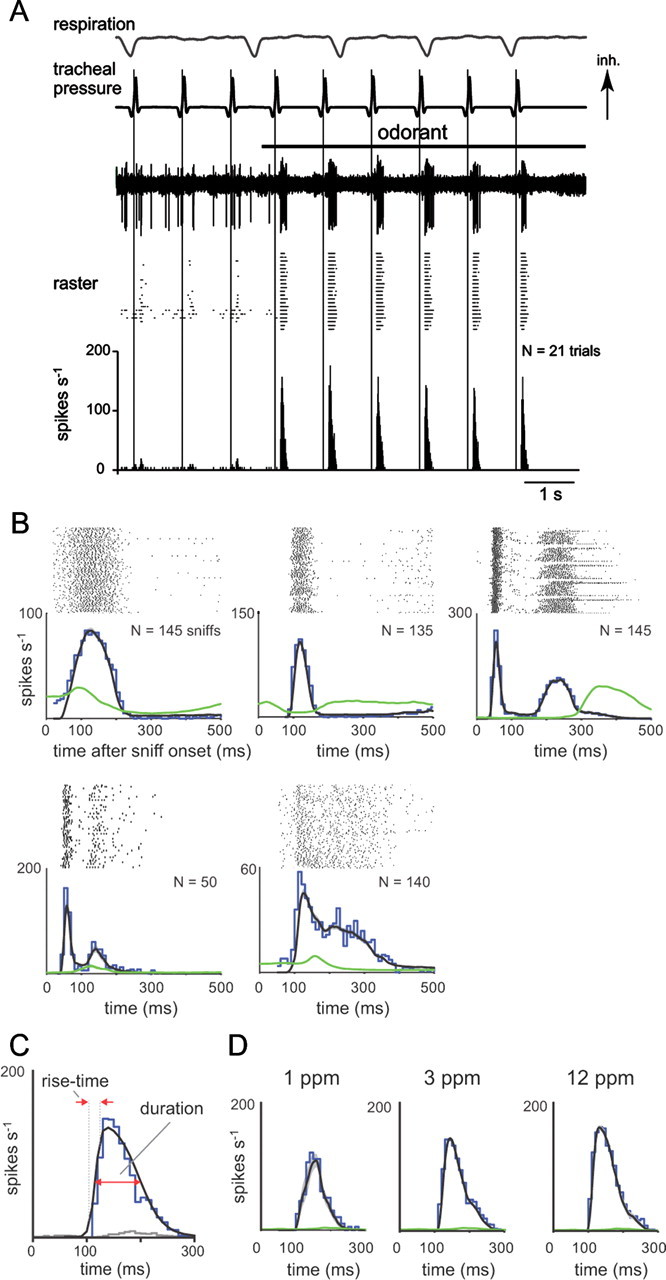
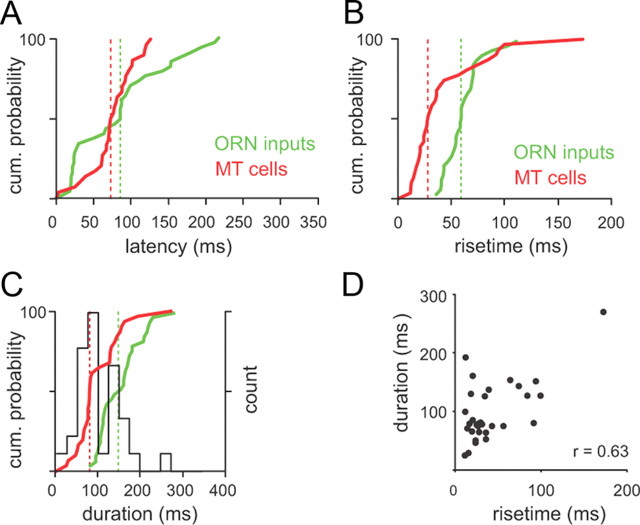
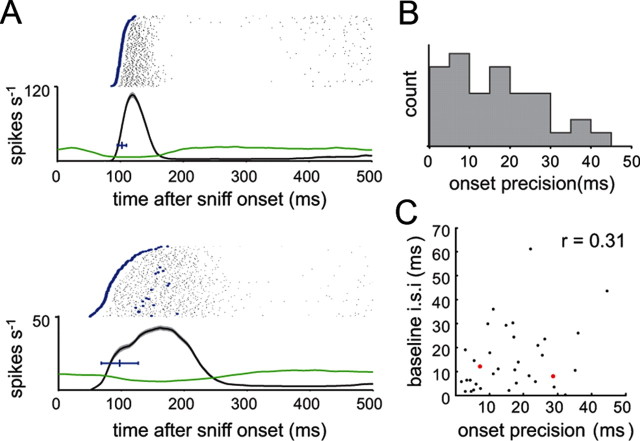
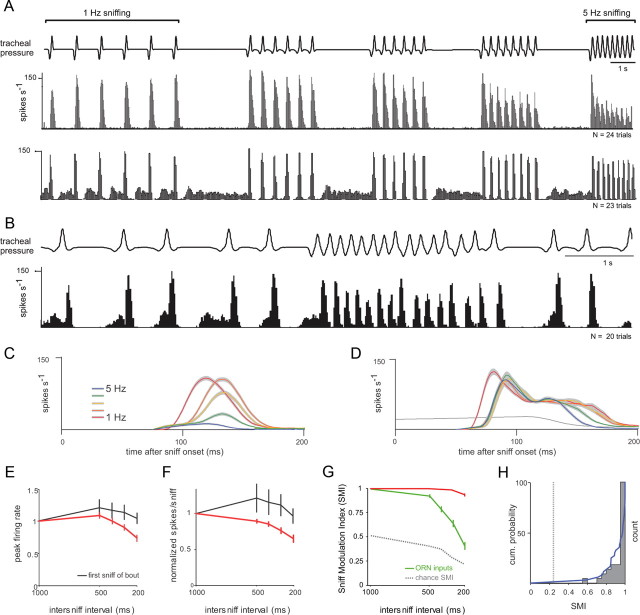
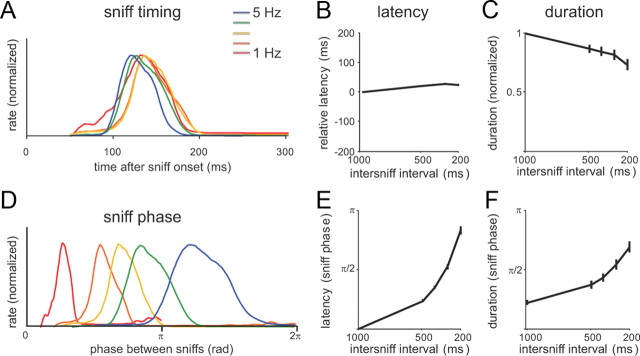
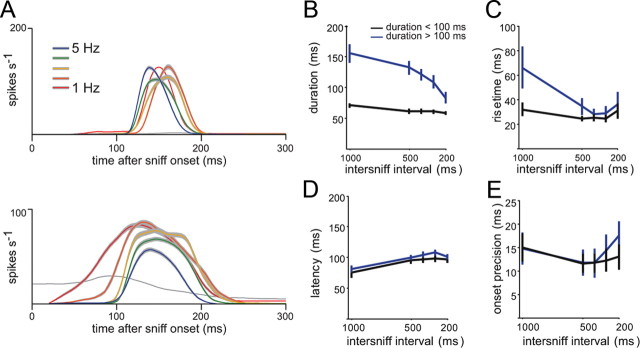
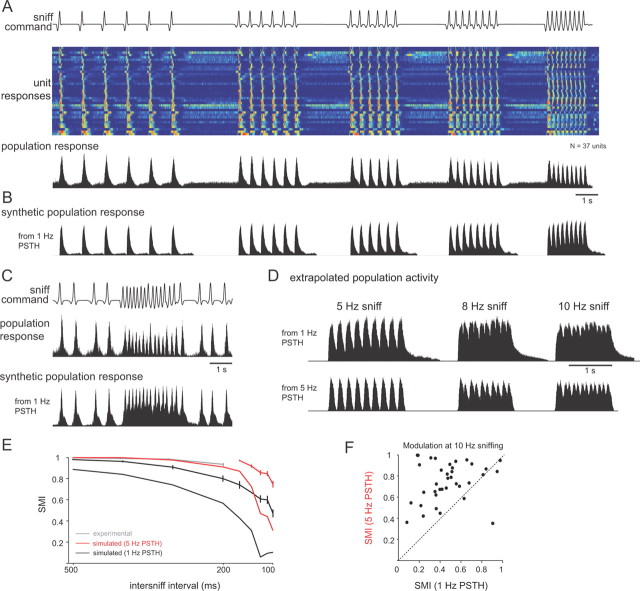
Neural activity underlying odor representations in the mammalian olfactory system is strongly patterned by respiratory behavior. These dynamics are central to many models of olfactory information processing. We have found previously that sensory inputs to the olfactory bulb change both their magnitude and temporal structure as a function of sniff frequency. Here, we ask how sniff frequency affects responses of mitral/tufted (MT) cells--the principal olfactory bulb output neurons. We recorded from MT cells in anesthetized rats while reproducing sniffs recorded previously from awake animals and varying sniff frequency. The dynamics of a sniff-evoked response were consistent from sniff to sniff but varied across cells. Compared to the dynamics of receptor neuron activation by the same sniffs, the MT response was shorter and faster, reflecting a temporal sharpening of sensory inputs. Increasing sniff frequency led to moderate attenuation of MT response magnitude and significant changes in the temporal structure of the sniff-evoked MT cell response. Most MT cells responded with a shorter duration and shorter rise-time spike burst as sniff frequency increased, reflecting increased temporal sharpening of inputs by the olfactory bulb. These temporal changes were necessary and sufficient to maintain respiratory modulation in the MT cell population across the range of sniff frequencies expressed during behavior. These results suggest that the input-output relationship in the olfactory bulb varies dynamically as a function of sniff frequency and that one function of the postsynaptic network is to maintain robust temporal encoding of odor information across different odor sampling strategies.


Figures

Figure 1.
Figure 1.
Sniff playback reliably drives ORN input to the OB in the anesthetized rat. A, Playback command trace reproducing sniff timing recorded from an awake, head-fixed rat (see Materials and Methods). Top trace, Playback command signal. Bottom traces, Tracheal pressure measurements from single playback trials of this command signal recorded from 17 rats. The pressure transients are highly reproducible from animal to animal. Inhalation (inh.) is up. B, Synthetic playback command trace consisting of bouts of sniffing at frequencies from 1 to 5 Hz (top), with a 2 s pause between each bout. Top trace, Command signal. Bottom trace, Tracheal pressure measurements recorded during playback in 36 rats. C, D, Presynaptic calcium signals reflecting ORN input to two glomeruli (glom. 1, 2) in one rat, evoked by sniff playback of the waveforms in A and B, respectively. Odorant (0.2% saturated vapor ethyl butyrate) was presented for the entire duration of the playback trace. Raw optical data from imaging (average of 4 trials) are shown in black; gray traces represent estimates of firing rate changes using temporal deconvolution (see Materials and Methods). In both glomeruli, ORN input was strongly driven by each sniff during sniff playback; glomerulus 1 maintained sniff patterning during high-frequency sniff bouts, whereas glomerulus 2 did not. Both glomeruli were imaged in the same trial. E, Increasing sniff frequency attenuates ORN response magnitudes. Error bars represent the mean ± SEM of the peak of the deconvolved ORN signal at each sniff frequency shown in B. Responses to the third and subsequent sniffs from each bout (black) show strong attenuation; responses to the first sniff of each bout (gray) also attenuate, presumably because of differences in the waveform of the sniff generated at each frequency (see Materials and Methods). Response amplitudes (estimated firing rates) are normalized to the 1 Hz response for each glomerulus (N = 33 glomeruli from 20 rats). F, Coherence of ORN inputs with sniffing also decreases with increasing sniff frequency. Error bars represent the mean ± SEM of the mean-squared coherence between the sniff pressure waveform and estimated ORN firing rate waveform for each glomerulus (N = 33; see Materials and Methods). Thus, sniff patterning of ORN inputs weakens at higher sniffing frequencies. G, Sniff-triggered averages of ORN inputs for the two glomeruli shown in (C) and (D) at sniff frequencies ranging from 1 to 5 Hz. Plots show the mean ± SEM of deconvolved presynaptic calcium signal. Increasing sniff frequency decreases response amplitudes, but the shape of the response transient remains relatively invariant across frequency.
Figure 2.
Figure 2.
Sniff playback drives presumptive MT cell responses with diverse but reliable temporal dynamics. A, Example recording from a presumptive MT cell during odorant presentation and sniff playback at 1 Hz frequency. The top three traces show, from top to bottom, intrinsic respiration measured with a photodiode, the sniff playback signal [inhalation (Inh) is up], and voltage signals from a representative playback trial in which odorant (horizontal black bar) is presented midway through the trial. Spike times from repeated trials are shown in the raster below, and the average response histogram (10 ms bins) for all trials is shown at the bottom. This unit shows weak responses to inhalation in the absence of odorant and strong excitatory transients in the presence of odorant. B, PSTHs, constructed as described in Materials and Methods, from five different MT cells illustrating diverse temporal responses to odorant. For each cell, the sniff-triggered spike raster is shown along with the PSTH evoked during odorant presentation (blue plot). The mean instantaneous firing rate (black trace; see Materials and Methods) tracks the PSTH well and is reliable from trial to trial; the variance of instantaneous firing rate (measured as SEM and shown in gray overlaid on the black trace) is generally not apparent in these plots. The instantaneous firing rate measured in the absence of odorant is shown in green. Each cell shows a transient excitation, with a distinct but reliable temporal pattern. C, Illustration of quantification of response dynamics using the PSTH for the MT cell shown in A. Spike raster, as well as odorant-driven PSTH (blue) and nonodorant PSTH (gray) are shown. The PSTH was fitted with a double-sigmoid curve (black); this curve was used to measure peak firing rate, rise time, and duration as indicated and described in Materials and Methods. D, Example of the effect of increasing odorant concentration on MT cell response dynamics. Spike rasters and PSTHs for a cell presented with odorant (heptaldehyde) at 1 ppm (N = 20 sniffs), 3 ppm (N = 126 sniffs), and 12 ppm (N = 48 sniffs). Panel elements and colors are as in B. In this cell, increasing odorant concentration increased peak firing rate and slightly shortened rise time and latency.
Figure 3.
Figure 3.
Temporal dynamics of MT cell responses during low-frequency sniffing. A, Sniff-evoked response latencies for MT cells versus ORN inputs. Plots show cumulative probability distributions of latency from inhalation to response onset for MT cell PSTHs (red) and ORN inputs (green). The median for each distribution is indicated by a vertical line. MT cell and ORN input latencies varied across a similar range (N = 37 MT cells; N = 33 glomeruli for ORN inputs for A–C). B, Response rise times for MT cells and ORN inputs; rise times of MT cell responses were shorter than those of ORN inputs. C, Response durations for MT cells and ORN inputs. MT cell response durations were shorter than ORN input durations. The distribution of MT cell durations was bimodal, with a separation at 100 ms (histogram shown in black). D, MT cell response rise times and durations were highly correlated (r = 0.62).
Figure 4.
Figure 4.
Precision of spike timing varies among MT cells. A, Spike rasters and instantaneous firing rates (mean ± SEM, black over gray shading), as well as preodor instantaneous firing rate (green), for two MT cells. Blue dots in spike rasters highlight the first spike after each sniff with an instantaneous firing rate that exceeds the mean preodor firing rate by one SD; the time of this first spike was the response “onset time” after each sniff. Horizontal blue bar indicates the mean ± SD of onset time across trials. Onset precision was defined as the SD of the onset time. In this example, the mean onset times for the two cells were similar, but one cell (top) had an SD of 7 ms, while the other had an SD of 29 ms. B, Distribution of precision times for 35 MT cells. Precision values ranged from 2 to 44 ms (median, 15 ms). C, There was no relationship between onset precision and baseline firing rate. Precision (SD of onset time) is plotted against mean baseline interspike interval for 35 MT cells. The two cells in A are highlighted in red; both had similar baseline firing rates (∼10 Hz).
Figure 5.
Figure 5.
Sniff frequency affects MT cell response amplitudes and modulation. A, Responses histogram from two MT cells recorded during playback of sniff bouts at increasing frequencies from 1 to 5 Hz. Top trace, Tracheal pressure during playback. Bottom plots, Spike histograms generated from repeated playback trials (N = 24 and 23 trials). Odorant (isoamyl acetate) was presented for the duration of the trace. In the first MT cell, responses to individual sniffs at lower frequencies were consistent throughout a bout, but as sniff frequency increased, bursts attenuated in amplitude, and responses showed less modulation by sniffing. In the second (bottom) cell, responses showed little or no attenuation in amplitude and maintained strong modulation at high frequencies. B, Spike histogram from the second cell in A during playback of the natural sniffing sequence. This cell responds faithfully to each sniff during both low-frequency sniffing and the high-frequency sniff bout. C, D, PSTHs of two different MT cells derived from sniffs at frequencies of 1–5 Hz. Plots show the mean ± SEM of instantaneous firing rate at each frequency. The gray line is the preodor firing rate. Only responses to the third and subsequent sniffs of each bout are included in this analysis. For cell 1 (C), response amplitudes and rise times were graded by sniff frequency. For cell 2 (D), there was little attenuation with frequency, but onset latencies were longer at frequencies above 1 Hz. E, F, Effect of sniff frequency on peak firing rate (E) and number of spikes per sniff (F) across all recorded MT cells (N = 37). Plots show the mean ± SEM values at each frequency. Red plots show responses to the third and subsequent sniffs; black plots show responses to the first sniff in each bout. Measurements were normalized to the value at 1 Hz sniffing. On average, higher sniff frequencies resulted in lower peak firing rates and fewer spikes per sniff with no effect on first-sniff responses. G, SMI decreases with increased sniff frequency. See Materials and Methods for calculation of the SMI. SMI values could range from 0 to 1, with 0 indicating no modulation in firing rate by sniffing; the chance SMI (see Materials and Methods) is shown in gray. Across all cells, SMI values (red) decreased only slightly (but significantly) with sniff frequency; in contrast, SMI values for ORN inputs (green) decreased sharply as sniff frequency increased. H, Distribution of SMI values for the 37 MT cells at 5 Hz sniffing. Blue plot shows cumulative probability distribution; gray dotted line indicates chance SMI for 5 Hz sniffing. Most cells showed very little loss of modulation (SMI values near 1) and thus maintained patterning. The cells with the highest SMI values at 5 Hz were generally those with shorter durations and faster rise times (see Results).
Figure 6.
Figure 6.
MT cell response patterns are relatively robust with respect to sniff onset time but not sniff phase. A, Sniff-evoked responses (mean instantaneous spike frequency) for a cell that shows very little change in response dynamics with sniff frequency. Response amplitudes are normalized to their peak values; color coding is as in previous figures. B, C, Effect of sniff frequency on relative response latency (B) or duration (C) measured across all MT cells (N = 31), measured in linear time. Latencies and durations are plotted relative to the values obtained at 1 Hz sniffing. D, Same sniff-evoked responses for the cell in A but plotted with respect to phase in the sniff cycle; a cycle is defined as the time from one sniff to the next. Thus, for example, responses to 5 Hz sniffing (200 ms intersniff interval; blue plot), which have a latency of ∼100 ms, are stretched to begin half-way through the sniff cycle (at ∼π radians). When viewed in this manner, response patterns change significantly with frequency. E, F, Effect of sniff frequency on response latencies (E) and duration (F) analyzed with respect to sniff phase (bottom). Both latencies and durations are plotted as their fraction of the sniff cycle with respect to sniff phase. Error bars indicate mean ± SEM.
Figure 7.
Figure 7.
Sniff-evoked response duration separates MT cells with distinct effects of sniff frequency. A, PSTHs at different frequencies for two MT cells with short (top) and long (bottom) response durations at 1 Hz sniffing. Mean ± SEM of instantaneous firing rates are shown and color coded as in Figure 5; gray plots show preodor firing rate. For the short-duration cell, responses show only minor changes in shape with increasing sniff frequency. For the longer-duration cell, however, as sniff frequency is increased, the peak spike rate, response duration, and rise time all decrease, whereas latency increases. B, C, Effect of sniff frequency on MT cell response duration (B) and rise times (C), plotted separately for short-duration MT cells (duration < 100 ms; black) and longer-duration cells (duration >100 ms; blue). Cells with shorter response durations (at 1 Hz) show no change in duration or rise time with increased sniff frequency, whereas those with initially longer response durations show significantly decreased durations (p < 0.001; ANOVA) and rise times (p < 0.05; paired t test between 1 and 5 Hz) at higher sniff frequencies. D, E, Effect of sniff frequency on response latency (D) and onset precision (E) for the same cells in B and C. Shorter- and longer-duration cells have similar latencies and precision values. For shorter-duration cells, there is a small but significant increase in response latency (D) with sniff frequency (p < 0.05; ANOVA). Precision values (E) are not affected by sniff frequency.
Figure 8.
Figure 8.
Frequency-dependent transformations in response dynamics enable robust temporal patterning across the MT cell population. A, Activity evoked by the same sniff playback trace across all recorded units (N = 37 cells), compiled independently of odorant identity or concentration. Top, Playback command trace. Middle, Pseudocolor representation of firing rates (5 ms bin) for each unit, normalized to peak firing rate for each unit, one unit per row. Units are ordered by single-sniff response duration, from shortest (top) to longest. Warm colors indicate peak firing rates. Bottom, Population activity histograms generated by averaging the response histograms from all units. Each histogram was normalized to its peak firing rate before averaging. B, “Synthetic” response histogram constructed by convolving the 1 Hz PSTHs with the sniff times for each unit and then averaging these activity patterns across all units. This approach predicts population-level response patterns based solely on the responses at 1 Hz sniffing. Comparing the synthetic patterns with the actual recorded responses (as in A) indicates the degree to which frequency-dependent changes in responses shape population-level activity. Responses constructed from 1 Hz PSTHs show less modulation with sniffing compared to actual responses (compare to A). C, Population activity histograms during playback of the natural sniffing sequence. Top, Playback command trace. Middle, Population activity histogram constructed as for A. Bottom, Synthetic response histogram constructed from 1 Hz PSTHs as for B. Again, activity across the MT population maintains strong patterning and modulation with sniffing, whereas the synthetic population pattern shows less modulation. D, Extrapolation of population responses to sniff frequencies up to 8 Hz using the PSTH convolution method. Synthetic population response histograms were constructed as in A using either 1 Hz (top) or 5 Hz (bottom) PSTHs from the same units by convolving with sniff times repeated at 8 and 10 Hz. Population responses show weak modulation with sniffing using the 1 Hz PSTHs (SMI at 8 Hz, 0.16) but stronger modulation using the 5 Hz PSTHs (SMI, 0.64). E, SMI values for all units as a function of frequency measured experimentally (gray), simulated using 1 Hz PSTHs (black) and 5 Hz PSTHs (red). SMI values were measured for frequencies extrapolated up to 10 Hz by convolution (see Materials and Methods). Traces with error bars show SMI values measured across individual units; those without error bars show the SMI value for the population-averaged response. SMI values were higher for the experimental data and for responses synthesized from 5 Hz PSTHs. F, SMI values for 10 Hz sniffing extrapolated for each unit using either 1 or 5 Hz PSTHs. For nearly all units, the SMI value was higher using the 5 Hz PSTH.

References

    1. Balu R, Larimer P, Strowbridge BW. Phasic stimuli evoke precisely timed spikes in intermittently discharging mitral cells. J Neurophysiol. 2004;92:743–753. - PubMed
    1. Bathellier B, Buhl DL, Accolla R, Carleton A. Dynamic ensemble odor coding in the mammalian olfactory bulb: sensory information at different timescales. Neuron. 2008;57:586–598. - PubMed
    1. Bhalla US, Bower JM. Multiday recordings from olfactory bulb neurons in awake freely moving rats: spatially and temporally organized variability in odorant response properties. J Comput Neurosci. 1997;4:221–256. - PubMed
    1. Carey RM, Verhagen JV, Wesson DW, Pirez N, Wachowiak M. Temporal structure of receptor neuron input to the olfactory bulb imaged in behaving rats. J Neurophysiol. 2009;101:1073–1088. - PMC - PubMed
    1. Chaput MA. Respiratory-phase-related coding of olfactory information in the olfactory bulb of awake freely-breathing rabbits. Physiol Behav. 1986;36:319–324. - PubMed

Publication types

LinkOut - more resources