. 2011 Nov;301(5):C1074-85.
doi: 10.1152/ajpcell.00131.2011. Epub 2011 Jul 20.

Kinetics of hyperosmotically stimulated Na-K-2Cl cotransporter in Xenopus laevis oocytes

Affiliations

Kinetics of hyperosmotically stimulated Na-K-2Cl cotransporter in Xenopus laevis oocytes

Eric Delpire et al. Am J Physiol Cell Physiol. 2011 Nov.

Abstract

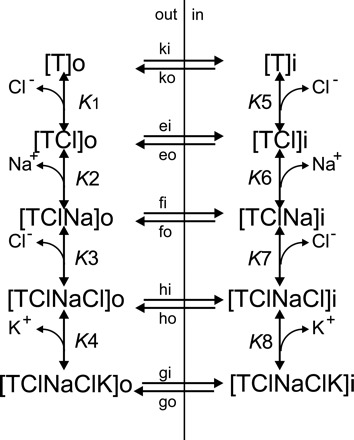
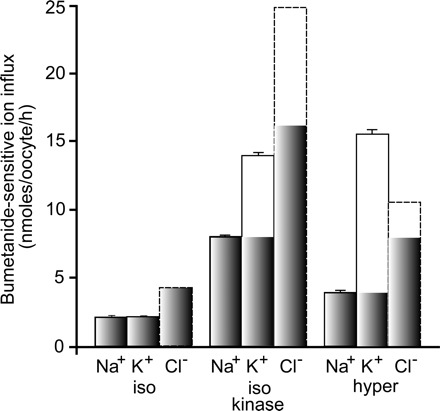
A detailed study of hypertonically stimulated Na-K-2Cl cotransport (NKCC1) in Xenopus laevis oocytes was carried out to better understand the 1 K(+):1 Cl(-) stoichiometry of transport that was previously observed. In this study, we derived the velocity equations for K(+) influx under both rapid equilibrium assumptions and combined equilibrium and steady-state assumptions and demonstrate that the behavior of the equations and curves in Lineweaver-Burke plots are consistent with a model where Cl(-) binds first, followed by Na(+), a second Cl(-), and then K(+). We further demonstrate that stimulation of K(+) movement by K(+) on the trans side is an intrinsic property of a carrier that transports multiple substrates. We also demonstrate that K(+) movement through NKCC1 is strictly dependent upon the presence of external Na(+), even though only a fraction of Na(+) is in fact transported. Finally, we propose that the larger transport of K(+), as compared with Na(+), is a result of the return of partially unloaded carriers, which masks the net 1Na(+):1K(+):2Cl(-) stoichiometry of NKCC1. These data have profound implications for the physiology of Na-K-2Cl cotransport, since transport of K-Cl in some conditions seems to be uncoupled from the transport of Na-Cl.


Figures

Fig. 1.
Fig. 1.
Rapid equilibrium model of Na-K-2Cl cotransport with the Na+ ion binding first. A: on the outside, the cotransporter exists in 5 different configurations, from empty to fully loaded. Once fully loaded, the translocation of the ions across the plasma membrane constitutes a rate limiting step of transport (rate constant = kp). Dissociation constants K1–K4 characterize the binding of each ion. B: simulation of Lineweaver-Burke plot of K+ influx−1 versus [Na+]o−1 based on Eq. 5 demonstrates that with this order of ion binding, the flux is almost independent of external Na+. The intercept of the lines in the left quadrant, which represents the reciprocal of the apparent affinity for Na+, is located far outside the range of the plot. Simulation was done with K1 set at 25 mM, K2 set at 1 mM, K3 set at 2 mM, and K4 set at 200 mM.
Fig. 2.
Fig. 2.
Rapid equilibrium model of Na-K-2Cl cotransport with one of the Cl ions binding first. A: order of ion binding is different from the order of ion binding in Fig. 1, and the dissociation constants have been reassigned accordingly. B: simulation of Lineweaver-Burke plot of K+ influx−1 vs. [Na+]o based on Eq. 9 demonstrates that with this order of ion binding, the flux is dependent upon external Na+. The intercept of the lines in the left quadrant, which represents the reciprocal of the apparent affinity for Na+, is located within the range of the plot. Simulation was done with K1 set at 1 mM, K2 set at 25 mM, K3 set at 200 mM, and K4 set at 2 mM.
Fig. 3.
Fig. 3.
Steady-state model of Na-K-Cl cotransport with partial transport reactions. The order of ion binding is identical to the order in Fig. 2, with Cl binding first, followed by Na+, Cl, and K+. The order of ion release on the inside of the cell is K+ followed by Cl, then Na+ and the second Cl. In the steady-state model, transporter complexes at the trans side affect the rate of transport at the cis side. Note that translocation reactions are allowed for all partially loaded carriers, to allow all possible transport reactions in the derivation of transport velocity.
Fig. 4.
Fig. 4.
Dependence of NKCC1-mediated K+ uptake on the external Na+ concentration. Hyperosmotic ouabain-resistant K+ uptake was measured using 86Rb tracer in NKCC1 cRNA-injected oocytes for 60 min, 10 min, 4 min, 2 min, and 1 min in the presence (96 mM) and absence (0 mM) of external Na+. Solutions were made hyperosmotic (265 mosM) with addition of 65 mM sucrose. Na+-free solution was made by replacing Na+ with N-methyl d-glucamine. Ouabain-resistant K+ uptake is expressed in nanomoles K+ per oocyte. Bars represent means ± SE (n = 20–25 oocytes).
Fig. 5.
Fig. 5.
NKCC1 transports less Na+ than K+. Ouabain-resistant unidirectional 86Rb and 22Na fluxes were measured in NKCC1 cRNA-injected oocytes incubated in isosmotic (200 mosM) and hyperosmotic (265 mosM) solution, in the presence and absence of 20 μM bumetanide. Fluxes were also measured in oocytes coinjected with NKCC1 cRNA and constitutively active SPAK cRNA in isosmotic solution. Bumetanide-sensitive K+ and Na+ influxes are expressed in nanomoles cation·oocyte−1·h−1. Bars represent means ± SE (n = 20–25 oocytes). SEs for bumetanide-sensitive flux were calculated as square roots of (SEM12 n1−1 + SEM22 n2−1). Cl influxes (dotted lines) are taken from earlier studies (17). Shaded bars indicate the classical 1Na+:1K+:2Cl−1 component of transport.
Fig. 6.
Fig. 6.
Ouabain-resistant influx and efflux measured through 86Rb movement. A: K+ and Rb+ influx was measured in NKCC1 cRNA-injected oocytes in the presence and absence of 20 μM bumetanide in isosmotic or hyperosmotic media containing either 4 mM KCl or 4 mM RbCl. Bars represent means ± SE (n = 20–25 oocytes). B: oocytes injected with NKCC1 cRNA were preloaded with 86Rb, and washout kinetics was measured in hyperosmotic solutions containing 4 mM K+ or 4 mM Rb+. After reconstituting the content of 86Rb in the oocytes at each time point and plotting the data [exponential decrease: 86Rb(t) = 86Rbt=0 e−kt] in semi-logarithmic form, the first-order rate constant for K+ efflux in the absence (○) or presence of 20 μM bumetanide (■) was measured as the slope of the linear component. Arrow indicates a change in external solution. Experiments were done in duplicate.
Fig. 7.
Fig. 7.
Trans effect of K+ on NKCC1-mediated K+ flux. A: effect of external K+ on the rate constant for 86Rb loss. Oocytes injected with NKCC1 cRNA and constitutively active SPAK cRNA were loaded overnight with 86Rb, and washout kinetics were measured in isosmotic solutions containing 4 mM K+ (■) or 0 mM K+ (○). After reconstituting the content of 86Rb in the oocytes at each time point and plotting the data [exponential decrease: 86Rb(t) = 86Rbt=0 e−kt] in semi-logarithmic form, the first-order rate constant for K+ efflux was measured as the slope of the linear component. Experiments were done in duplicate. B: effect of internal K+ on K+ influx. Oocytes injected with NKCC1 cRNA were treated with nystatin in solutions containing 79 mM Li+ (0 mM K+) or 79 mM K+, then fluxed with 86Rb in the regular hyperosmotic solution. A third untreated group consisted of NKCC1 cRNA-injected oocytes. Bars represent means ± SE (n = 20–25 oocytes).
Fig. 8.
Fig. 8.
Double reciprocal plots of ouabain-resistant K+ influx at various external Na+, K+, and Cl concentrations. A and B: [Na+]o at different external K+ concentrations or [K+]o at different external Na+ concentrations. External Na+ was varied from 10 mM to 80 mM (N-methyl d-glucamine substitution), whereas external K+ was varied from 2 mM to 20 mM. External Cl was kept constant at 104 mM (see Table 1). C and D: [Na+]o at different external Cl concentrations or [Cl]o at different external Na+ concentrations. External Na+ was varied from 10 mM to 92 mM (N-methyl d-glucamine substitution), whereas external Cl was varied from 10 mM to 30 mM (methysulfamate substitution). External K+ was kept constant at 4 mM (see Table 1). E and F: [Cl]o at different external K+ concentrations or versus [K+]o at different external Cl concentrations. External K+ was varied from 1 mM to 8 mM (N-methyl d-glucamine substitution), whereas external Cl was varied from 15 mM to 45 mM (methysulfamate substitution). External Na+ was kept constant at 92 mM (see Table 1). Each point represents means ± SE (n = 16 oocytes). Points were fitted by linear regression using Prism 3.0 (GraphPad).
Fig. 9.
Fig. 9.
Ouabain-resistant versus ouabain-resistant and bumetanide-sensitive K+ influx measured at various Cl concentrations under isosmotic conditions. A: K+ uptake was measured in NKCC1 cRNA-injected oocytes at Cl concentrations ranging from 80 to 10 mM in the absence (empty columns) or presence (solid columns) of 20 μM bumetanide. Bars represent means ± SE (n = 20–25 oocytes). B: data from A were plotted in double-reciprocal form with bumetanide-sensitive flux determined as the difference between total flux and flux in the presence of bumetanide.
Fig. 10.
Fig. 10.
Ouabain-resistant flux as a function of external Cl through NKCC1 under isosmotic and hyperosmotic conditions. K+ influx was measured in NKCC1 cRNA-injected oocytes at Cl concentrations ranging from 80 to 10 mM. The cotransporter was stimulated either by coinjection of constitutively active kinase cRNA under isosmotic (○) or hyperosmotic (■) conditions. Each point represents mean ± SE (n = 16 oocytes).

References

    1. Aiton JF, Brown CD, Ogden P, Simmons NL. K+ transport in “tight” epithelial monolayers of MDCK cells. J Membr Biol 65: 99–109, 1982 - PubMed
    1. Baudouin-Legros M, Brouillard F, Cougnon M, Tondelier D, Leclerc T, Edelman A. Modulation of CFTR gene expression in HT-29 cells by extracellular hyperosmolarity. Am J Physiol Cell Physiol 278: C49–C56, 2000 - PubMed
    1. Beck FX, Grünbein R, Lugmayr K, Neuhofer W. Heat shock proteins and the cellular response to osmotic stress. Cell Physiol Biochem 10: 303–306, 2000 - PubMed
    1. Benjamin BA, Johnson EA. A quantitative description of the Na-K-2Cl cotransporter and its conformity to experimental data. Am J Physiol Renal Physiol 273: F473–F482, 1997 - PubMed
    1. Brock TA, Brugnara C, Canessa M, Gimbrone MAJ. Bradykinin and vasopressin stimulate Na+-K+-Cl− cotransport in cultured endothelial cells. Am J Physiol Cell Physiol 250: C888–C895, 1986 - PubMed

LinkOut - more resources