. 2011 Nov;106(5):2108-19.
doi: 10.1152/jn.00540.2011. Epub 2011 Jul 20.

Cross-orientation suppression in human visual cortex

Affiliations

Cross-orientation suppression in human visual cortex

Gijs Joost Brouwer et al. J Neurophysiol. 2011 Nov.

Abstract

Cross-orientation suppression was measured in human primary visual cortex (V1) to test the normalization model. Subjects viewed vertical target gratings (of varying contrasts) with or without a superimposed horizontal mask grating (fixed contrast). We used functional magnetic resonance imaging (fMRI) to measure the activity in each of several hypothetical channels (corresponding to subpopulations of neurons) with different orientation tunings and fit these orientation-selective responses with the normalization model. For the V1 channel maximally tuned to the target orientation, responses increased with target contrast but were suppressed when the horizontal mask was added, evident as a shift in the contrast gain of this channel's responses. For the channel maximally tuned to the mask orientation, a constant baseline response was evoked for all target contrasts when the mask was absent; responses decreased with increasing target contrast when the mask was present. The normalization model provided a good fit to the contrast-response functions with and without the mask. In a control experiment, the target and mask presentations were temporally interleaved, and we found no shift in contrast gain, i.e., no evidence for suppression. We conclude that the normalization model can explain cross-orientation suppression in human visual cortex. The approach adopted here can be applied broadly to infer, simultaneously, the responses of several subpopulations of neurons in the human brain that span particular stimulus or feature spaces, and characterize their interactions. In addition, it allows us to investigate how stimuli are represented by the inferred activity of entire neural populations.


Figures

Fig. 1.
Fig. 1.
Stimulus and experimental protocol. Stimuli were contrast-reversing sinusoidal gratings, within a annular aperture. A: in the weight estimation experiment, stimuli were full-contrast gratings, with 6 different orientations. ISI, interstimulus interval. B: in the cross-orientation suppression experiment, stimuli were vertical target gratings with different contrasts either in isolation (target-only condition) or superimposed with a high-contrast, horizontal, mask grating (target + mask condition). In the control experiment (not shown) we used identical gratings, but the target and mask were temporally interleaved and doubled in contrast.
Fig. 2.
Fig. 2.
A: voxel selection. Distribution of F-statistic values taken from V1 of 1 representative subject. The F-statistic quantifies how well a single voxel differentiates between stimulus orientations: a voxel with a low F-statistic (left) shows no significant bias for orientation, while a voxel with a high F-statistic (right) shows a clear (and significant) tuning, centered on 60°. fMRI, functional magnetic resonance imaging. B: orientation decoding with the forward model. The accuracy of orientation decoding using the forward model is plotted against the accuracy using a conventional classifier. Each data point represents a scanning session. The forward model reduced the high-dimensional (no. of voxels) voxel space to a low-dimensional (no. of channels = 6) channel space. This dimensionality reduction did not result in a considerable loss of information. The decoding accuracies were nearly the same, but the conventional classifier utilized all the information in the full, high-dimensional voxel space. Classification was performed with a 8-way maximum likelihood classifier, implemented by the Matlab (Mathworks) function ‘classify’ with the option ‘diaglinear’.
Fig. 3.
Fig. 3.
Stability of weight estimation across sessions. A: estimating the weights in one session and then applying these weights to fit the data of a second session revealed r2 values significantly higher than chance: the mean r2 value was 0.54, many standard deviations away from the null distribution of r2 values. The null distribution was obtained by shuffling the weights between the voxels. B: accuracy of the forward model in decoding orientation in one session, using weights estimated from a different session. Decoding accuracy was significantly higher than expected by chance: the mean accuracy of 0.56 was in the 99.75th percentile of the null distribution. The null distribution was obtained by shuffling the weights between the voxels. C: session-to-session comparison of the preferred orientation. Each data point represents a voxel. The preferred orientation (a continuous measure) of each voxel was computed by using the response amplitudes to each stimulus orientation in the weight estimation experiment. Points cluster around the diagonal, indicating that the preferred orientations of most voxels were stable between sessions. The size of each point represents r2, the proportion of the variance in the voxel's response time course that was accounted for by the regression model (i.e., the regression matrix and hemodynamic impulse response function that was used to estimate the response amplitudes). Voxels with a robust responses to the stimuli (higher r2 values) tended to have stable weights across sessions (closer to the diagonal).
Fig. 4.
Fig. 4.
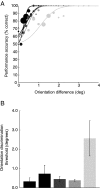
Psychophysical results. A: psychometric functions (see materials and methods) for 1 representative subject. Symbol size is proportional to number of trials, which differed because of the staircase procedure (see materials and methods). SF, spatial frequency. B: orientation-discrimination thresholds (75% correct), averaged across subjects. Error bars, SE across subjects. Colors indicate the different conditions as described in A.
Fig. 5.
Fig. 5.
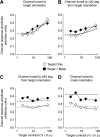
Cross-orientation suppression in human V1. Each panel plots responses of orientation-selective channels. Solid (target only) and dashed (target + mask) curves depict the best fit of the normalization model. A: channel tuned to target orientation. B: average of the 2 channels adjacent to the target channel (±30°). C: average of the 2 channels adjacent to the mask channel (±60°). D: channel tuned to the orientation of the mask. Error bars: SE across subjects. r.m.s, root mean square.
Fig. 6.
Fig. 6.
No cross-orientation suppression for the control experiment. Same format as Fig. 5.
Fig. 7.
Fig. 7.
Cross-orientation suppression in individual subjects. A: V1 channel responses for the cross-orientation suppression experiment. Each row corresponds to a different subject (same format as Fig. 5). B: best-fit contrast gain (σ) parameter values. x-Axis, target only; y-axis, target + mask. Circles, cross-orientation suppression experiment; squares, control experiment; filled symbols, individual subjects; open symbols, fit of the mean responses across subjects. For the cross-orientation experiment, the σ values for target only were lower than those for target + mask, indicating a shift in contrast gain. For the control experiment, the contrast gain was similar with and without the mask.
Fig. 8.
Fig. 8.
Population responses. A: population responses to the cross-orientation suppression experiment. Left: target-only condition. Right: target + mask condition. Target contrast increases from top to bottom in each column. Solid curves depict the best-fit normalization model. B: control experiment. Same format as A. Error bars: SE across subjects.
Fig. 9.
Fig. 9.
Mean V1 responses. A: mean responses (averaged across V1 voxels) for the cross-orientation suppression experiment. Solid (target only) and dashed (target + mask) curves depict the best fit of a model that includes cross-orientation suppression. B: mean responses for the control experiment. Solid (target only) and dashed (target + mask) curves depict the best fit of a model that does not include cross-orientation suppression.

References

    1. Brouwer GJ, Heeger DJ. Decoding and reconstructing color from responses in human visual cortex. J Neurosci 29: 13992–14003, 2009 - PMC - PubMed
    1. Brouwer GJ, van Ee R. Visual cortex allows prediction of perceptual states during ambiguous structure-from-motion. J Neurosci 27: 1015–1023, 2007 - PMC - PubMed
    1. Busse L, Wade AR, Carandini M. Representation of concurrent stimuli by population activity in visual cortex. Neuron 64: 931–942, 2009 - PMC - PubMed
    1. Carandini M, Heeger DJ. Summation and division by neurons in primate visual cortex. Science 264: 1333–1336, 1994 - PubMed
    1. Carandini M, Heeger DJ, Movshon JA. Linearity and normalization in simple cells of the macaque primary visual cortex. J Neurosci 17: 8621–8644, 1997 - PMC - PubMed

Publication types

LinkOut - more resources